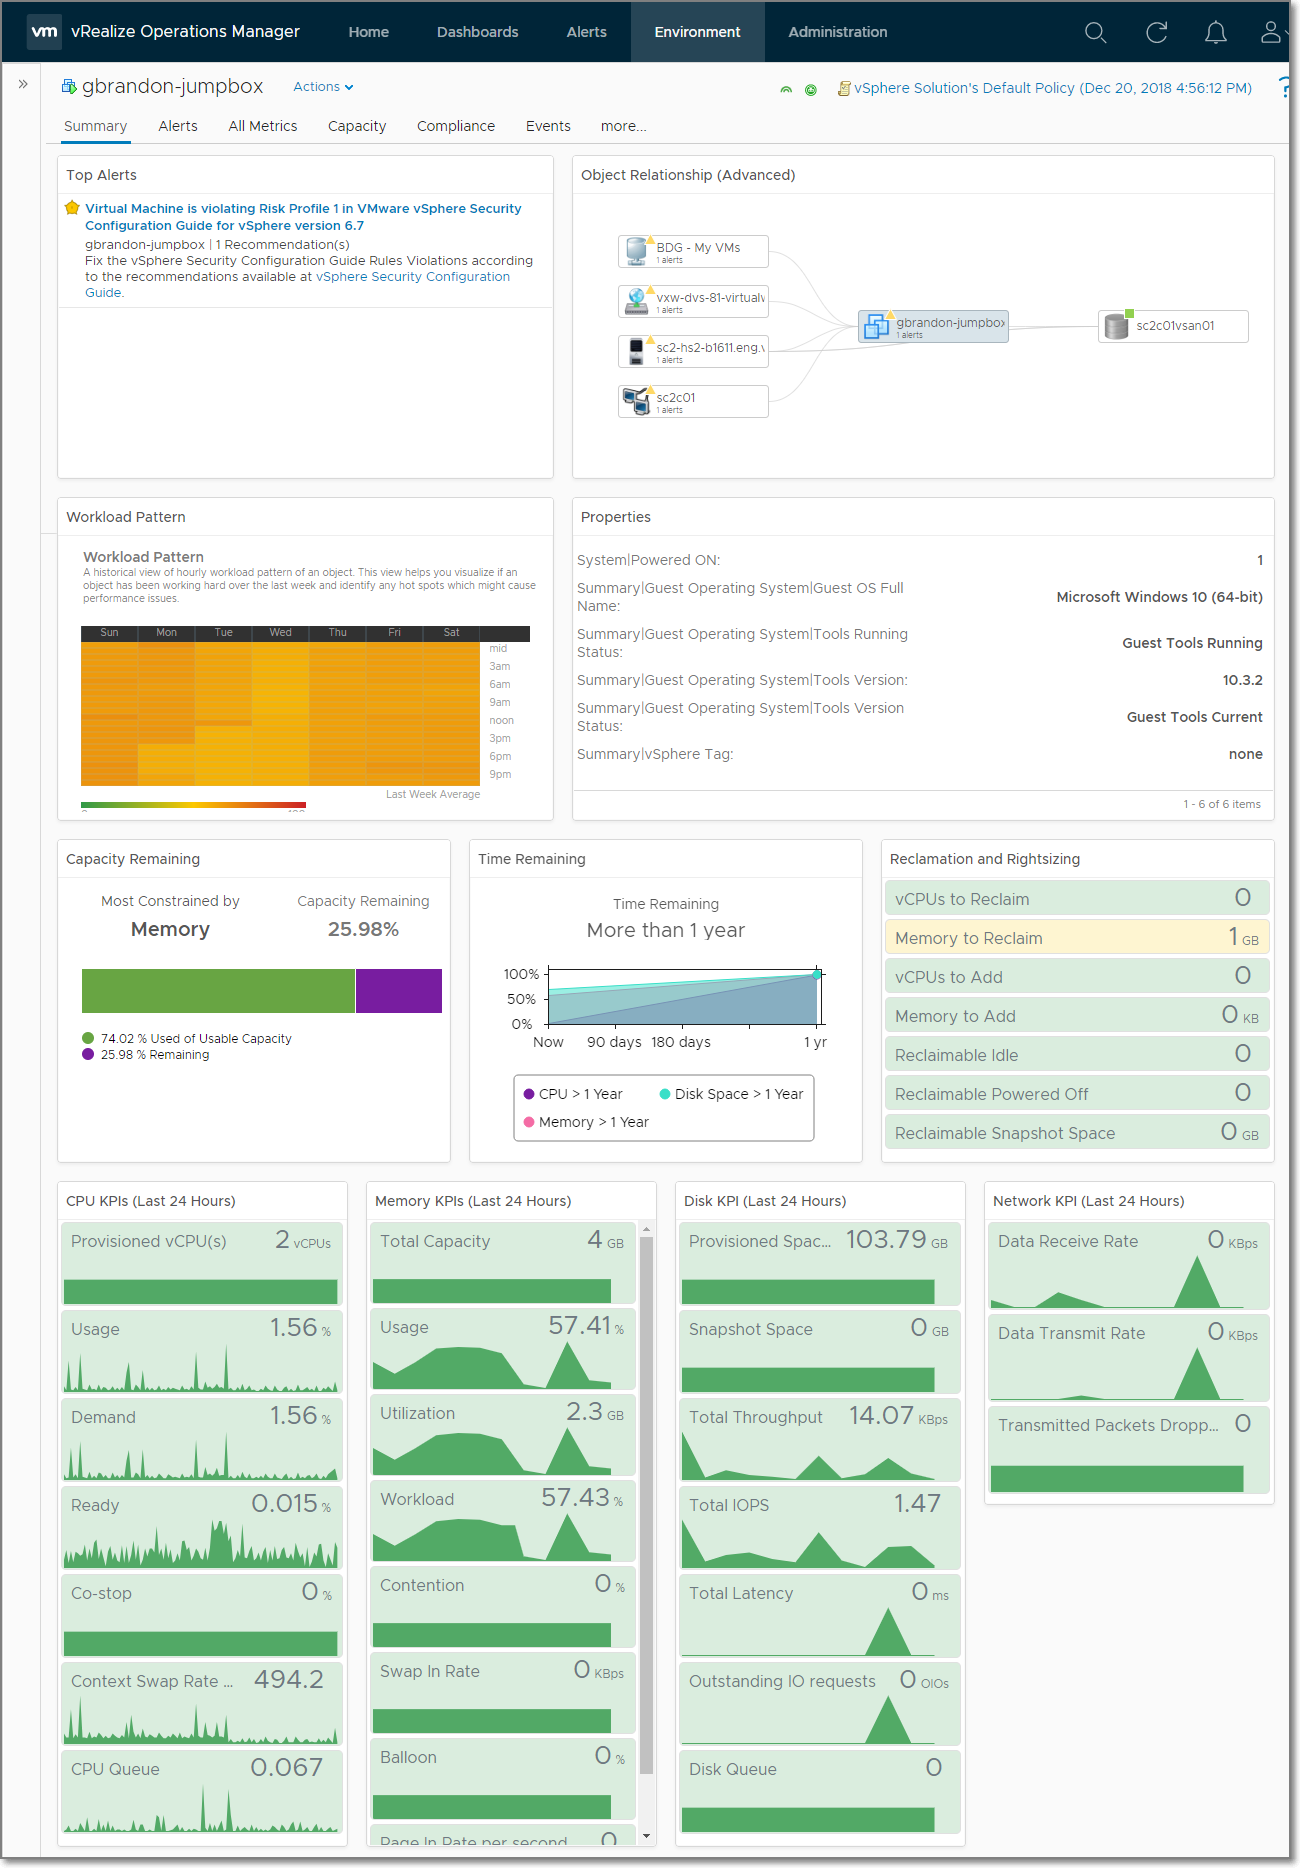
This dashboard is designed to replace the out of the box summary dashboard for Virtual Machine objects in vRealize Operations. It's intended to give a high level overview of a virtual machine by showing alerts, capacity, and performance KPIs to help quickly identify areas of concern for additional troubleshooting.
- Import the dashboard at
Dashboards/Actions/Manage Dashboards/Import Dashboards.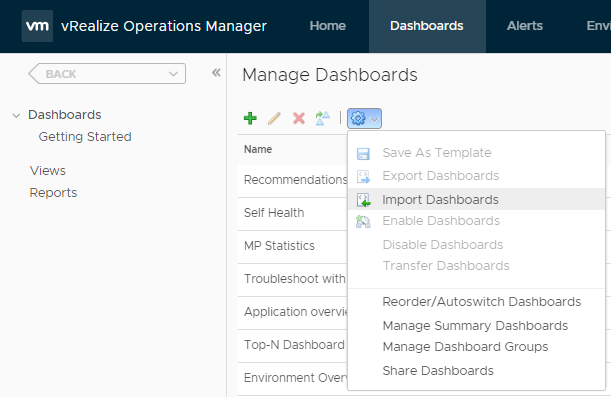
- Click
Browse...then select the file named Dashboard - Custom VM Summary.zip - The dashboard should now be available in in the dashboard list. Note: The dashboard should show as disabled as it will not be usable as a typical dashboard.

- Click the gear icon then select
Manage Summary Dashboards.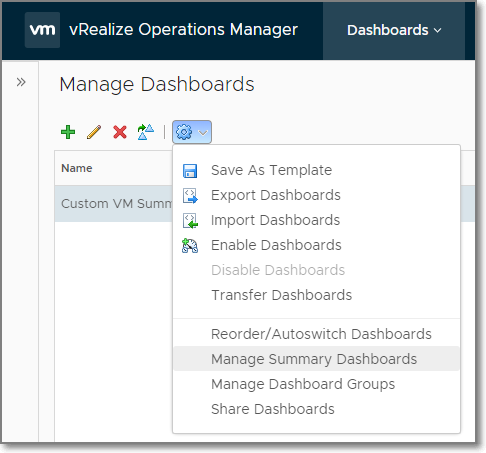
- Search for
Virtual Machine, selectVirtual Machine, then clickAssign a dashboard.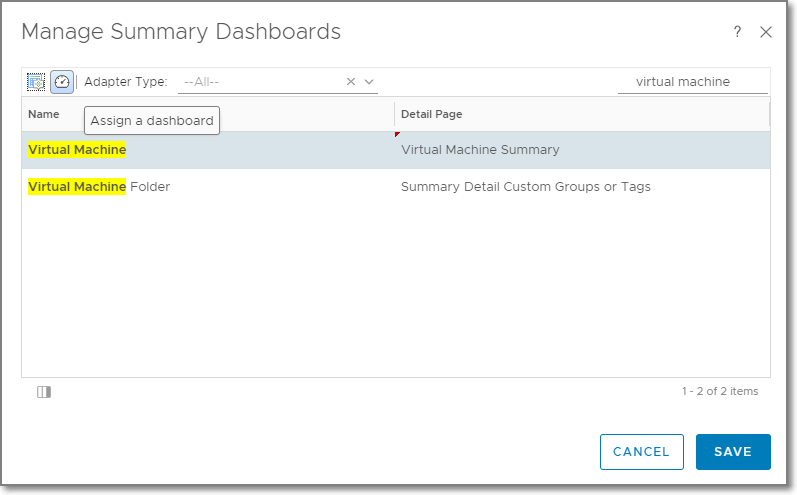
- Select
Custom VM Summarydashboard from the list then clickOK.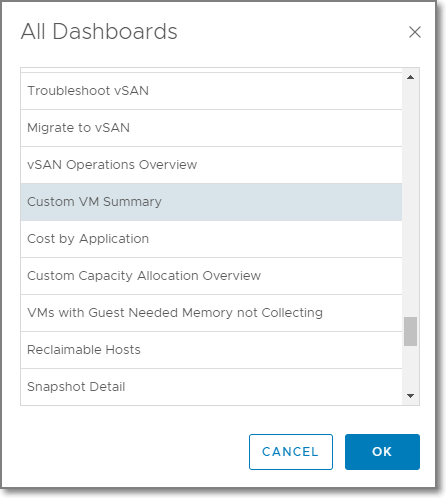
- Click
Save.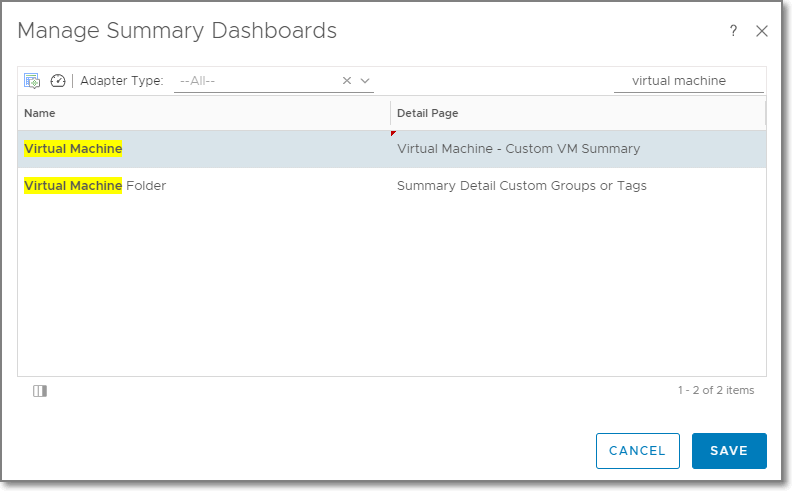
- Navigate to a Virtual Machine and view the new custom summary dashboard.
This dashboard requires vRealize Operation 7.0, 7.5, or 8.0 Advanced or Enterprise edition.
Please open an issue for feedback.
