Another Plotting Widget #3067
Comments
|
Great!! |
|
Looking very nice, thanks for sharing! I agree that if the public interface was changed to use raw pointer + size and raw |
|
Thanks for the feedback fellas. @ocornut, my original usage example (since updated) did a poor job of illustrating this, but ImGui::PlotInterface and ImGui::PlotItem are both meant to be used as persistent objects, created upfront. They are passed by reference to ImGui::Plot(...). Unless I'm missing something, I don't think there would be any copying of I'll noodle on making this more C like. In general, I think the interface could certainly be made more ImGui-esque, e.g, something similar to the way tabs work: // hypothetical usage
if (ImGui::BeginPlot("MyPlot", &plot) {
ImGui::PlotLine("My Line Plot", xs, ys, color);
ImGui::PlotScatter("My Scatter Plot", xs, ys, color);
ImGui::PlotBar("My Bar Plot", xs,ys,width,color);
// potentially other plot types, e.g. error bars, box plot, etc.
...
ImGui::EndPlot();
}Some state keeping would need to be done behind the scenes, but I think it's doable. |
|
This is awesome! I was looking around for some real-time plotting widgets I could use in my ImGui app and this fits. Thanks for sharing! I'll report any feedback as I start to incorporate it into my project. |
|
Thanks! I hope it works well for you. I've add two functions
I can also confirm plots will work as a drag-and-drop target. Here's a simple proof-of-concept (source):
|


|
This is awesome! I may try using this for one of my audio analysis projects :) The one thing seems to be missing that would be a great addition is the ability to have a "stride" much like the vanilla ImGui Plots. I often have audio data in which their L/R channels are interleaved in a single array so its very handy to be able to pass the plot a reference to the raw data and a stride to plot a single channel, rather then having un-interleave the array whenever it gets updated. |
|
Thanks @abrigante! I also have considered a stride based interface. I'll put this on the TODO list. PRs are always welcome as well! |
|
Also, since you mentioned audio, note that there is currently no option for logarithmic axes, but it's something I want (and need) to incorporate soon. |
Noted! I may have some free-time soon and I'll try to get around to implementing those two features and submitting a PR for it. |
|
plz add tooltip PlotItem |
ImGui tooltips work just fine, e.g.: ImGui::Plot("My Rolling Plot", plot, items);
if (ImGui::IsItemHovered()) {
ImGui::BeginTooltip();
ImGui::Text("My Plot");
ImGui::EndTooltip();
}Did you mean something else? Please be more specific. |
|
No, add Tootip for PlotItem. When hover mouseover the PlotItem, appeared tooltip with name or data PlotItem. |

|
I see. I didn't add this for a few reasons:
I guess it could be made an optional setting, perhaps for each axis, with a special magnitude checking case if both axes need to be queried. E.g.: if (plot.x_axis.tooltip && plot.y_axis.toolip) {
// check all x and y points using magnitude distance
}
else if (plot.x_axis.tooltip) {
// check all x points using x distance only
}
else if (plot.y_axis.tooltip) {
// check all y points using y distance only
}If you want to implement this and submit a PR, I'd be happy to review it. For now though, I don't think this is something I have time to work on. Sorry. |
Great job! It will be great to have also multiple y axis an additional feature can be by drag/drop to group measures under a specific y axis (red and blue under one y axis and green in another y axis) Digital signals X axis with time or date/time representation |


|
Plotting in real time mode 4 channels (items) with PlotItemBufferPoint max_points at 4096 will crash after some time.. (around 128[s]) In order to solve the issue, is there any other solution than uncomment '#define ImDrawIdx unsigned int' line in imconfig.h." ? |
|
It’s not something I’ve investigated, as I have been working with 32 bit indices. I think we’d need to implement some sort of culling scheme. As it is, there is no culling...every point is sent to the DrawList, even if it is outside the plot area. Seems like low hanging fruit, so maybe I can take a look. This of course won’t solve your issue if all 4x4096 points are in the plot area. If that’s the case, then it might be possible to decimate the data. |
|
Since 1.71 (2019/06) it is possible for the back-ends to set |
|
I've added a simple culling solution for Line and Scatter plot types. For Scatter, I simply don't render a point if it is outside of the plot area. For Line, I don't render a line sub-segment if both its endpoints are outside of the plot area. This, however, is not robust to line segments that jump across the plot area (i.e. both endpoints are outside the plot area, but the line actually crosses the plot area). This typically won't happen unless you are very zoomed in on the data. The only other solution that comes to mind is to add a line intersection test between all segments and each of the 4 lines bounding the plot area. This seems unreasonable, so I'm open to other suggestions. |
Enabling RederHasVtxOffset is passing assertion but not solving the issue. |
|
@ozlb Did you actually handle the ImDrawCmd’s VtxOffset field correctly in the renderer? Its not just having enabling a flag stating the renderer can do it, it also needs to be done. Check the various renderers for an example of what they do. |
To be honest I simply enable it. I will try to study and understand what should be done in order to handle it properly. In this moment I don't know how to do it and I'm not skilled to be able to reply properly, but I'm sure that I start from OpenGL2 official renderer and probably it's not supported. |
|
Thanks for sharing very nice tool! |
|
There is no built-in way to do what you are asking, but you could just simply make a separate PlotItem that only plots the points you want to distinguish, and uses a different color and/or maker size. I currently only support filled circles for scatter plots. Crosses are a good idea. I may look into supporting different maker styles. |
|
@epezent thanks for your smart response! |
|
Sure, shouldn't be a problem. The vector of PlotItems are rendered from front to back, so make sure the PlotlLine item comes before the subset PlotScatter item so that the line is under the circle makers. |
|
@ecraven any code for this task? Where can I insert this? |
|
Pseudo-code (not tested): // init
std::vector<ImGui::PlotItem> items(2);
items[0].type = ImGui::PlotItem::Line;
items[0].data = {{0,0},{1,1},{2,2},{3,3},{4,4}};
items[0].color = {1,0,0,1};
items[1].type = ImGui::PlotItem::Scatter;
items[1].data = {{0,0},{3,3}};
items[1].color = {0,1,0,1};
...
// update loop
ImGui::Plot("My Plot", my_plot, items); |
|
Thanks, but I do not find the function Plot() in the current version |
|
This isn't built into ImGui, it is a separate library. I suggest you reread the first post. |
|
Understood! Can I use your imgui_plot* in the old version of imGui? |
|
I suppose, though I'm not sure how far back you could go before certain functions start missing. I've only tested it with 1.75 (docking branch). |
|
Ok ! I will test it tomorrow , yhanks |
I managed to build using OpenGL3 renderer and i can confirm that with VtxOffset it's perfectly working with default is 16-bit vertex indices. |
|
@epezent I have tested your codes with my imGUI 1.0. It is not compatible and has many errors. |
|
Had a memory issue when plotting data with very large values. Found the issue to be in the rendering of the mouse position if plot.show_mouse_pos was true. Upped the char buffer to size 100 (arbitrary choice) and seems to have fixed it. |
…ows being outside of imgui viewport.
|
@epezent How can I display 2 plots arranged vertically (one over another). |
|
@Thanh-Binh, first, you shouldn't be putting all of that code in your update loop. Everything except for the two calls to ImGui::Plot should be done prior to entering the loop. Second, the reason you can't see the second plot is because the default behavior for plots is to fill the available XY space (i.e. size = ImVec2(-1,-1). So, you should provide an explicit size argument to the first call to ImGui::Plot, e.g. ImVec2(-1, 300). |
|
@epezent thanks for your quick response. |
|
@epezent understood now your 1st point! Thanks |
|
@epezent how can I change the marker size in PlotItem::Scatter? Thanks |
|
Great!!!! |
|
@jujujuhuakai I don't have any quick fixes at the moment. I'm already rendering lines as efficiently as I know how through the ImGui drawing API. The obvious answer to your problem is to down sample the data (e.g. only render every Nth point would be the simplest method). This isn't built into my API (yet), so you'll need to handle it yourself. @ocornut has hinted that changes are coming to ImGui that may give line rendering a performance boost (mahilab/mahi-gui#8 (comment)). |
|
Hi everyone! After receiving your feedback, I have turned this widget into a more refined plotting API: ImPlotYou can read about the new features in #3173 The TL/DR version is:
Thank you all for the positive feedback. I hope you continue to find this useful! Closing the issue to avoid future confusion. |
|
Hi, First I wanna to thank you for this fantastic library. |
This widget is DEPRECATED! Please see the new library ImPlot and #3173
Original Post:
Thought I would share an enhanced plotting widget I created. This can be considered an alternative to soulthread's implementation, which was missing a few features I think are useful. The source code has been made a part of my organization's GUI toolkit, but is completely self contained to two files:
imgui_plot.hpp
imgui_plot.cpp
Several examples can be found here (see
plots_*.cppfiles). I do make use of std::vector and std::string for convenience, but I can't imagine it would be very difficult to strip out. I may eventually move this to its own repository, or submit a pull request if there is interest (though this probably too obtuse to belong in the core ImGui library).Features
Controls
Usage
Configuration
Rendering
Special Notes
IMGUI_PLOT_LINE_USE_AAat the top ofimgui_plot.cpp.#define ImDrawIdx unsigned intin yourimconfig.hfile, OR handling theImGuiBackendFlags_RendererHasVtxOffsetflag in your renderer (the official OpenGL3 renderer supports this). If you fail to do this, then you will at some point hit the maximum number of indices that can be rendered.Examples
Zooming/Panning
Misc. Controls
Set Labels and Show/Hide Elements
Real Time Plotting
Adapts to Current Theme
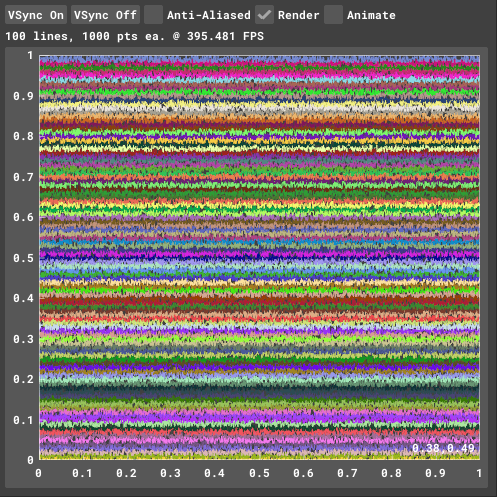
Thousands of Points!
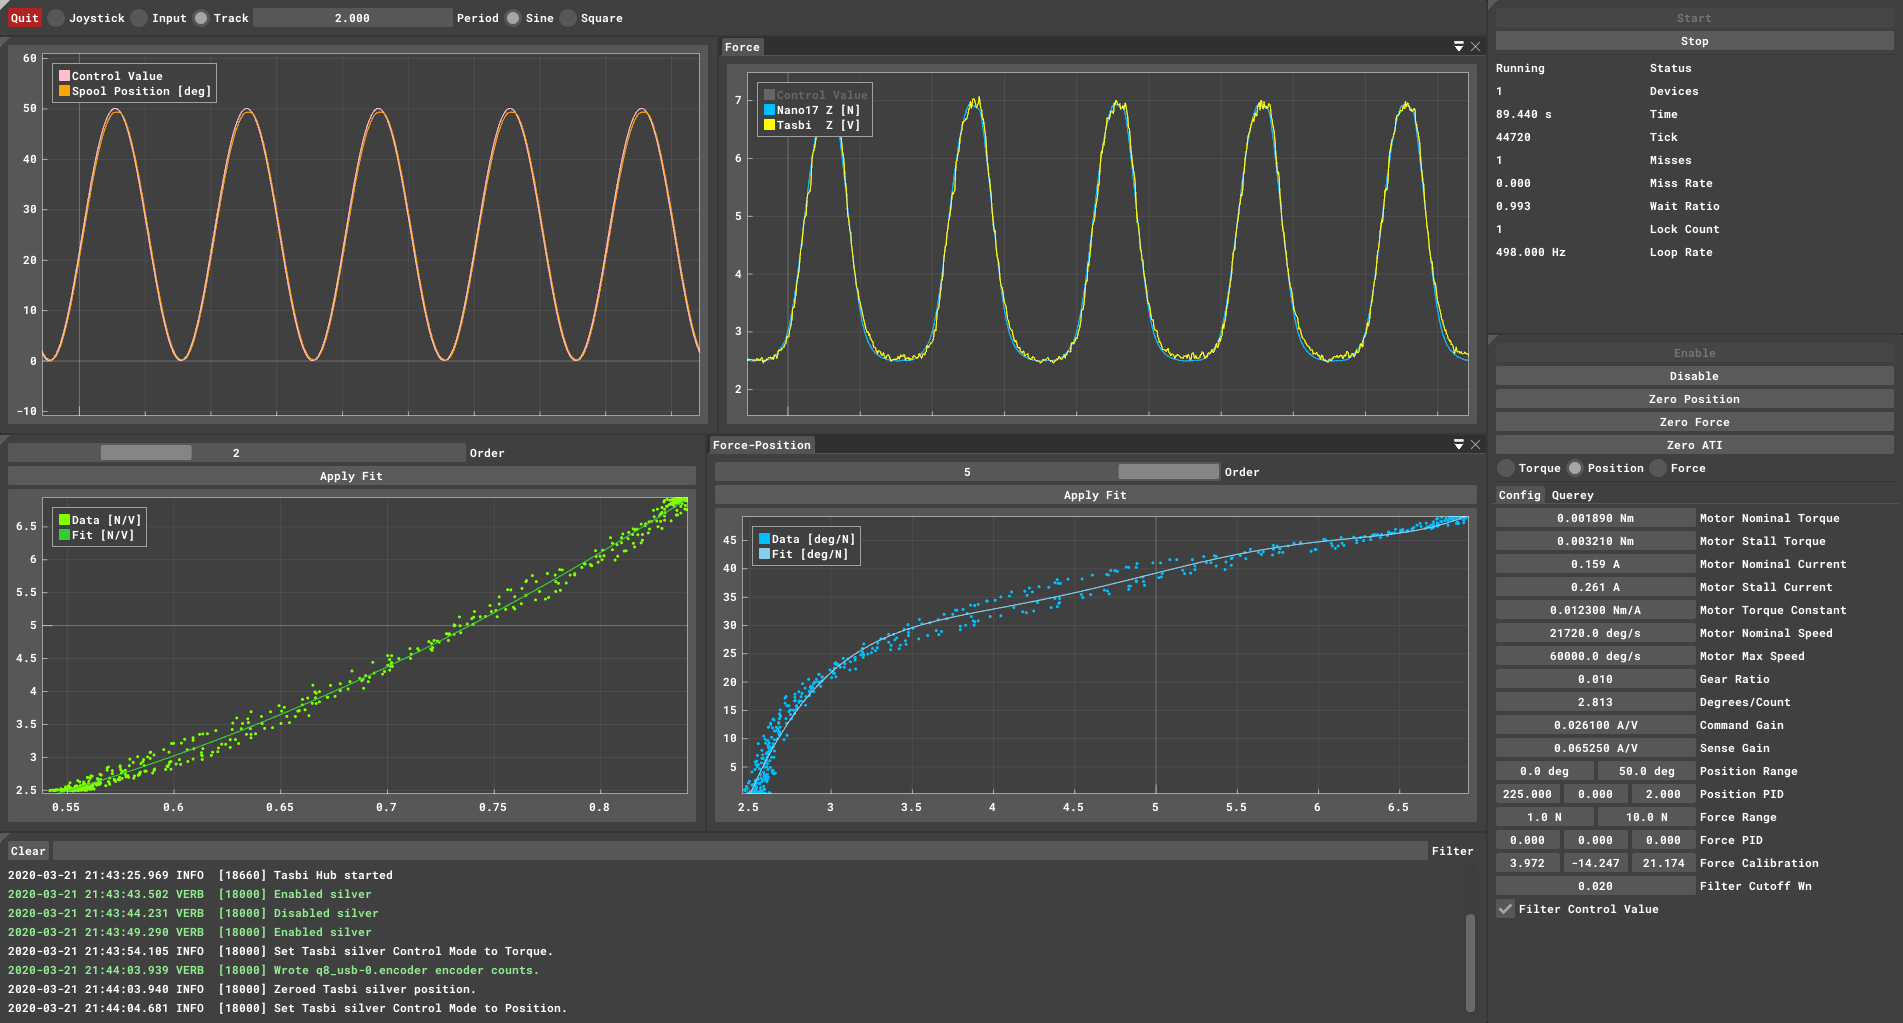
In Practice
The text was updated successfully, but these errors were encountered: