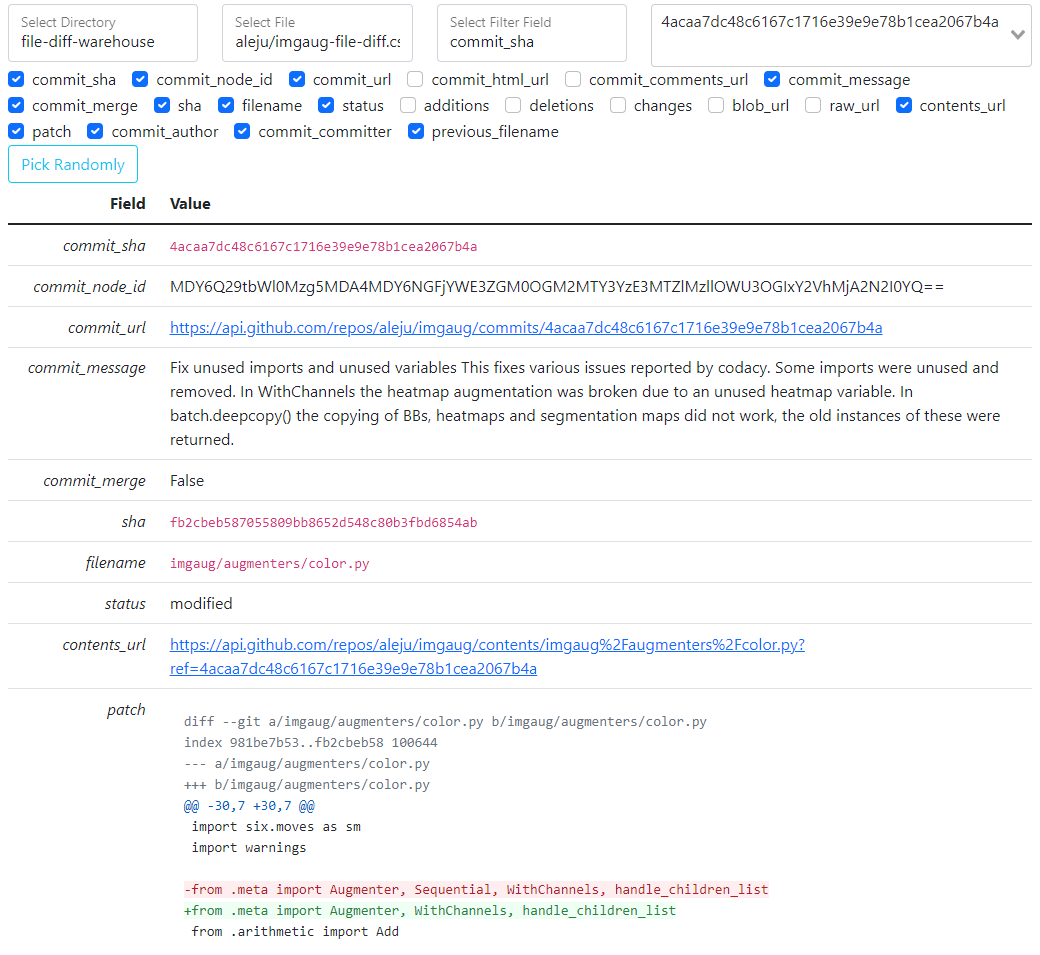
While dealing with large CSV files to understand the quality of the data, it is painful in the table view of pandas or Excel. So, I build this data-visualizer app.
It shows one entry at a time with syntax highlighting. I can choose which columns to see and pick entries randomly to better understand the quality/distribution of the data.
Install node.js, yarn, python ≥ 3.6, and pip.
Then, to install node dependencies, run
yarn installTo install python dependencies, run
pip intall flask flask-cors pandasTo run the app, first put your files in <dataset_dir>/<subdir>.
The run
export DATASET_ROOT=<dataset_dir>
yarn serve
It will run the app on http://localhost:3000.
Here you will have the option to select appropriate <subdir> and the files within.