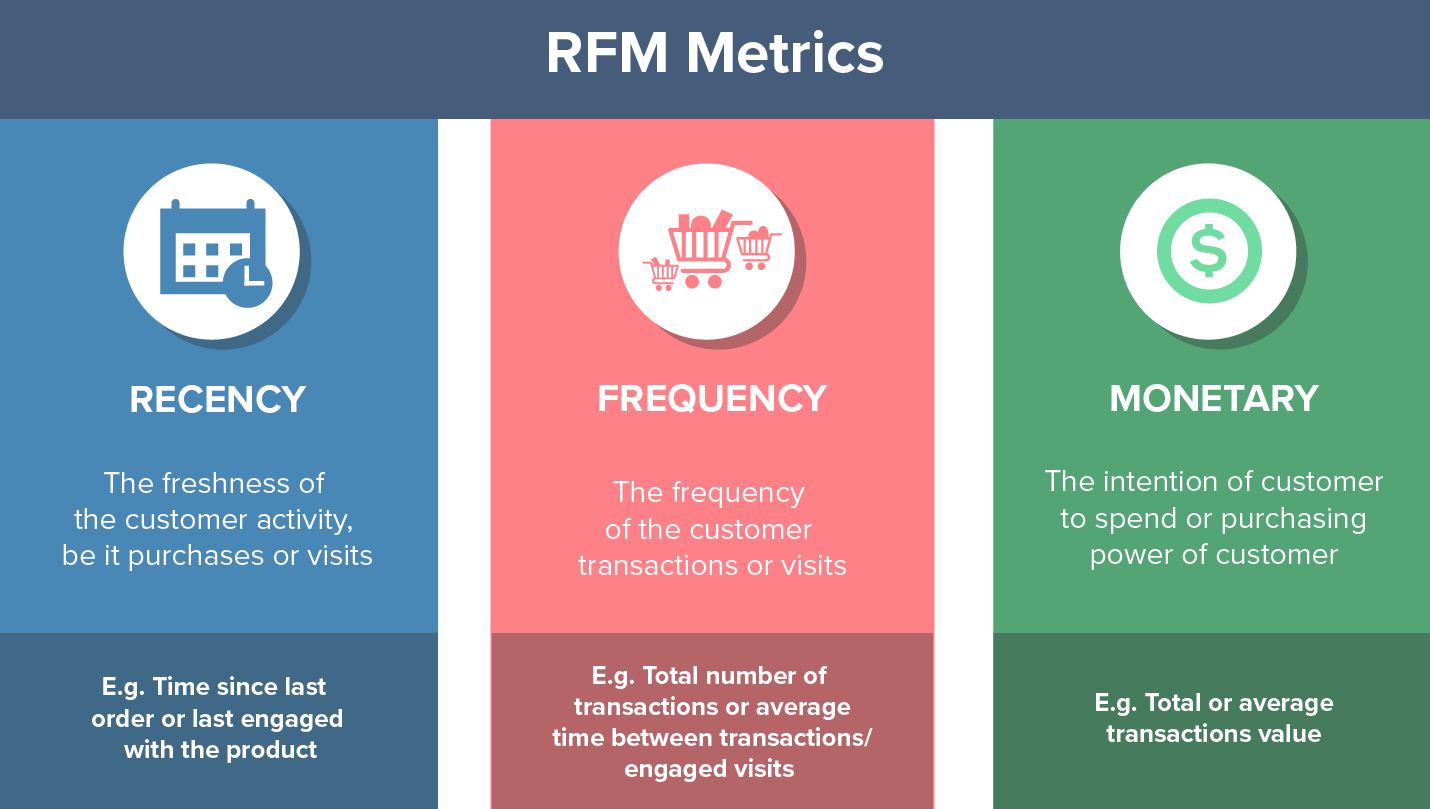
RFM is an acronym representing Recency, Frequency, and Monetary value, wherein each component correlates with crucial customer attributes. These RFM metrics serve as significant indicators of customer behavior, as frequency and monetary value directly impact a customer's lifetime value, while recency influences retention, a metric reflective of engagement
Businesses without a direct monetary component, such as those focused on viewership, readership, or surfing-oriented products, may opt for Engagement parameters in lieu of Monetary factors. This adaptation results in the utilization of RFE, a variant of RFM. Moreover, the Engagement parameter can be delineated as a composite value derived from metrics such as bounce rate, visit duration, number of pages visited, time spent per page, among others.
The RFM factors underscore the following insights:
The recency of a purchase positively correlates with the customer's responsiveness to promotions. Higher frequency in customer purchases indicates increased engagement and satisfaction. The monetary value serves as a distinguishing factor, delineating heavy spenders from low-value purchasers
"SuperStore Company is a global retail company - Global. So the company has many customers. On the occasion of Christmas and New Year, the Marketing Department wants to run marketing campaigns to thank customers for supporting the company over the past time. As well as exploiting customers who have the potential to become loyal customers.
However, the Marketing Department has not yet been able to group each customer this year because the data set is too large to be processed manually like in previous years, so we asked the Data Analysis Department to assist in implementing a classification problem. Segment each customer to deploy each marketing program suitable for each customer group.
The Marketing Director also suggested using the RFM model, but in the past when the company was small, the team could calculate and classify it themselves using Excel. Currently, the amount of data is too large, so we want the Data Department to build a flow to deploy Segmentation evaluation through Python programming
Dataset includes 2 different related tables including: transaction informationfrom 2011 to 2012 and RFM classification
-
Transaction information dataframe


-
Segmentation dataframe:


The data presented in the table reveals a notable high mean value for Recency, indicating that customers are inclined to discontinue their association with Superstore in the future. Conversely, there is an absence of positive signals in Frequency, with a mean value of 4.3, falling below the normal range, and a median of 2, signaling a significant concern for SuperStore. Despite these challenges, the Monetary aspect exhibits a positive side, with a mean value exceeding 2000
The charts illustrating revenue and customer distribution across segments highlight that the Champions group, constituting 19.15% of the customer base, contributes more than 60% of the revenue. Following closely in revenue are the Loyal and At-risk groups, contributing 12% and 8.2%, respectively. However, Hibernating and Lost customers account for 16.4% and 13.1%, respectively, yet purchase fewer types of products, at 3.3% and 1.4%, respectively. The Need Attention group, comprising 5% of revenue, represents only 6.2% of total customers, necessitating special attention
Examining the chart depicting customer segments, it is evident that the Championship group constitutes the largest portion at around 60%, signifying that Superstore possesses a considerable number of loyal customers
The revenue chart underscores the significance of the Championship and Loyal groups as the highest contributors to the store's earnings
The division of other customer groups into potential and in-danger categories reveals opportunities and risks. Potential customers include Hibernating customers, potential loyalists, promising, and new customers
To address these insights, it is imperative for Superstore to concentrate efforts on increasing both Recency and Frequency values. This strategic focus will likely contribute to customer retention and overall store performance
Superstore should focus efforts on engaging with the Need Attention group, understanding their preferences, and implementing strategies to enhance their contribution to both revenue and overall customer satisfaction
To maintain this strong customer base, Superstore should implement targeted marketing campaigns, such as personalized offers, exclusive discounts, and special services, to reinforce the loyalty of the Championship group
Superstore should implement marketing campaigns tailored to the Championship and Loyal groups, focusing on strategies like birthday gifts, new product experiences, discounted offerings, and personalized customer care to strengthen their loyalty
For potential customers, Superstore should introduce a loyalty program, engage actively on social media, and encourage customer referrals. In contrast, in-danger customers should be identified and rewarded for their value, while feedback should be actively sought and utilized for continuous improvement
In conclusion, Superstore should personalize marketing messages, provide exclusive benefits to loyal customers, and implement targeted strategies for potential and in-danger customer groups to enhance overall customer satisfaction and store performance