Welcome to ComutPlotLib, a Python tool for generating genomic comutation plots. These plots visualize co-occurrence patterns of genomic alterations—mutations, copy number variations (CNVs), and other genetic events—across multiple patients or samples.
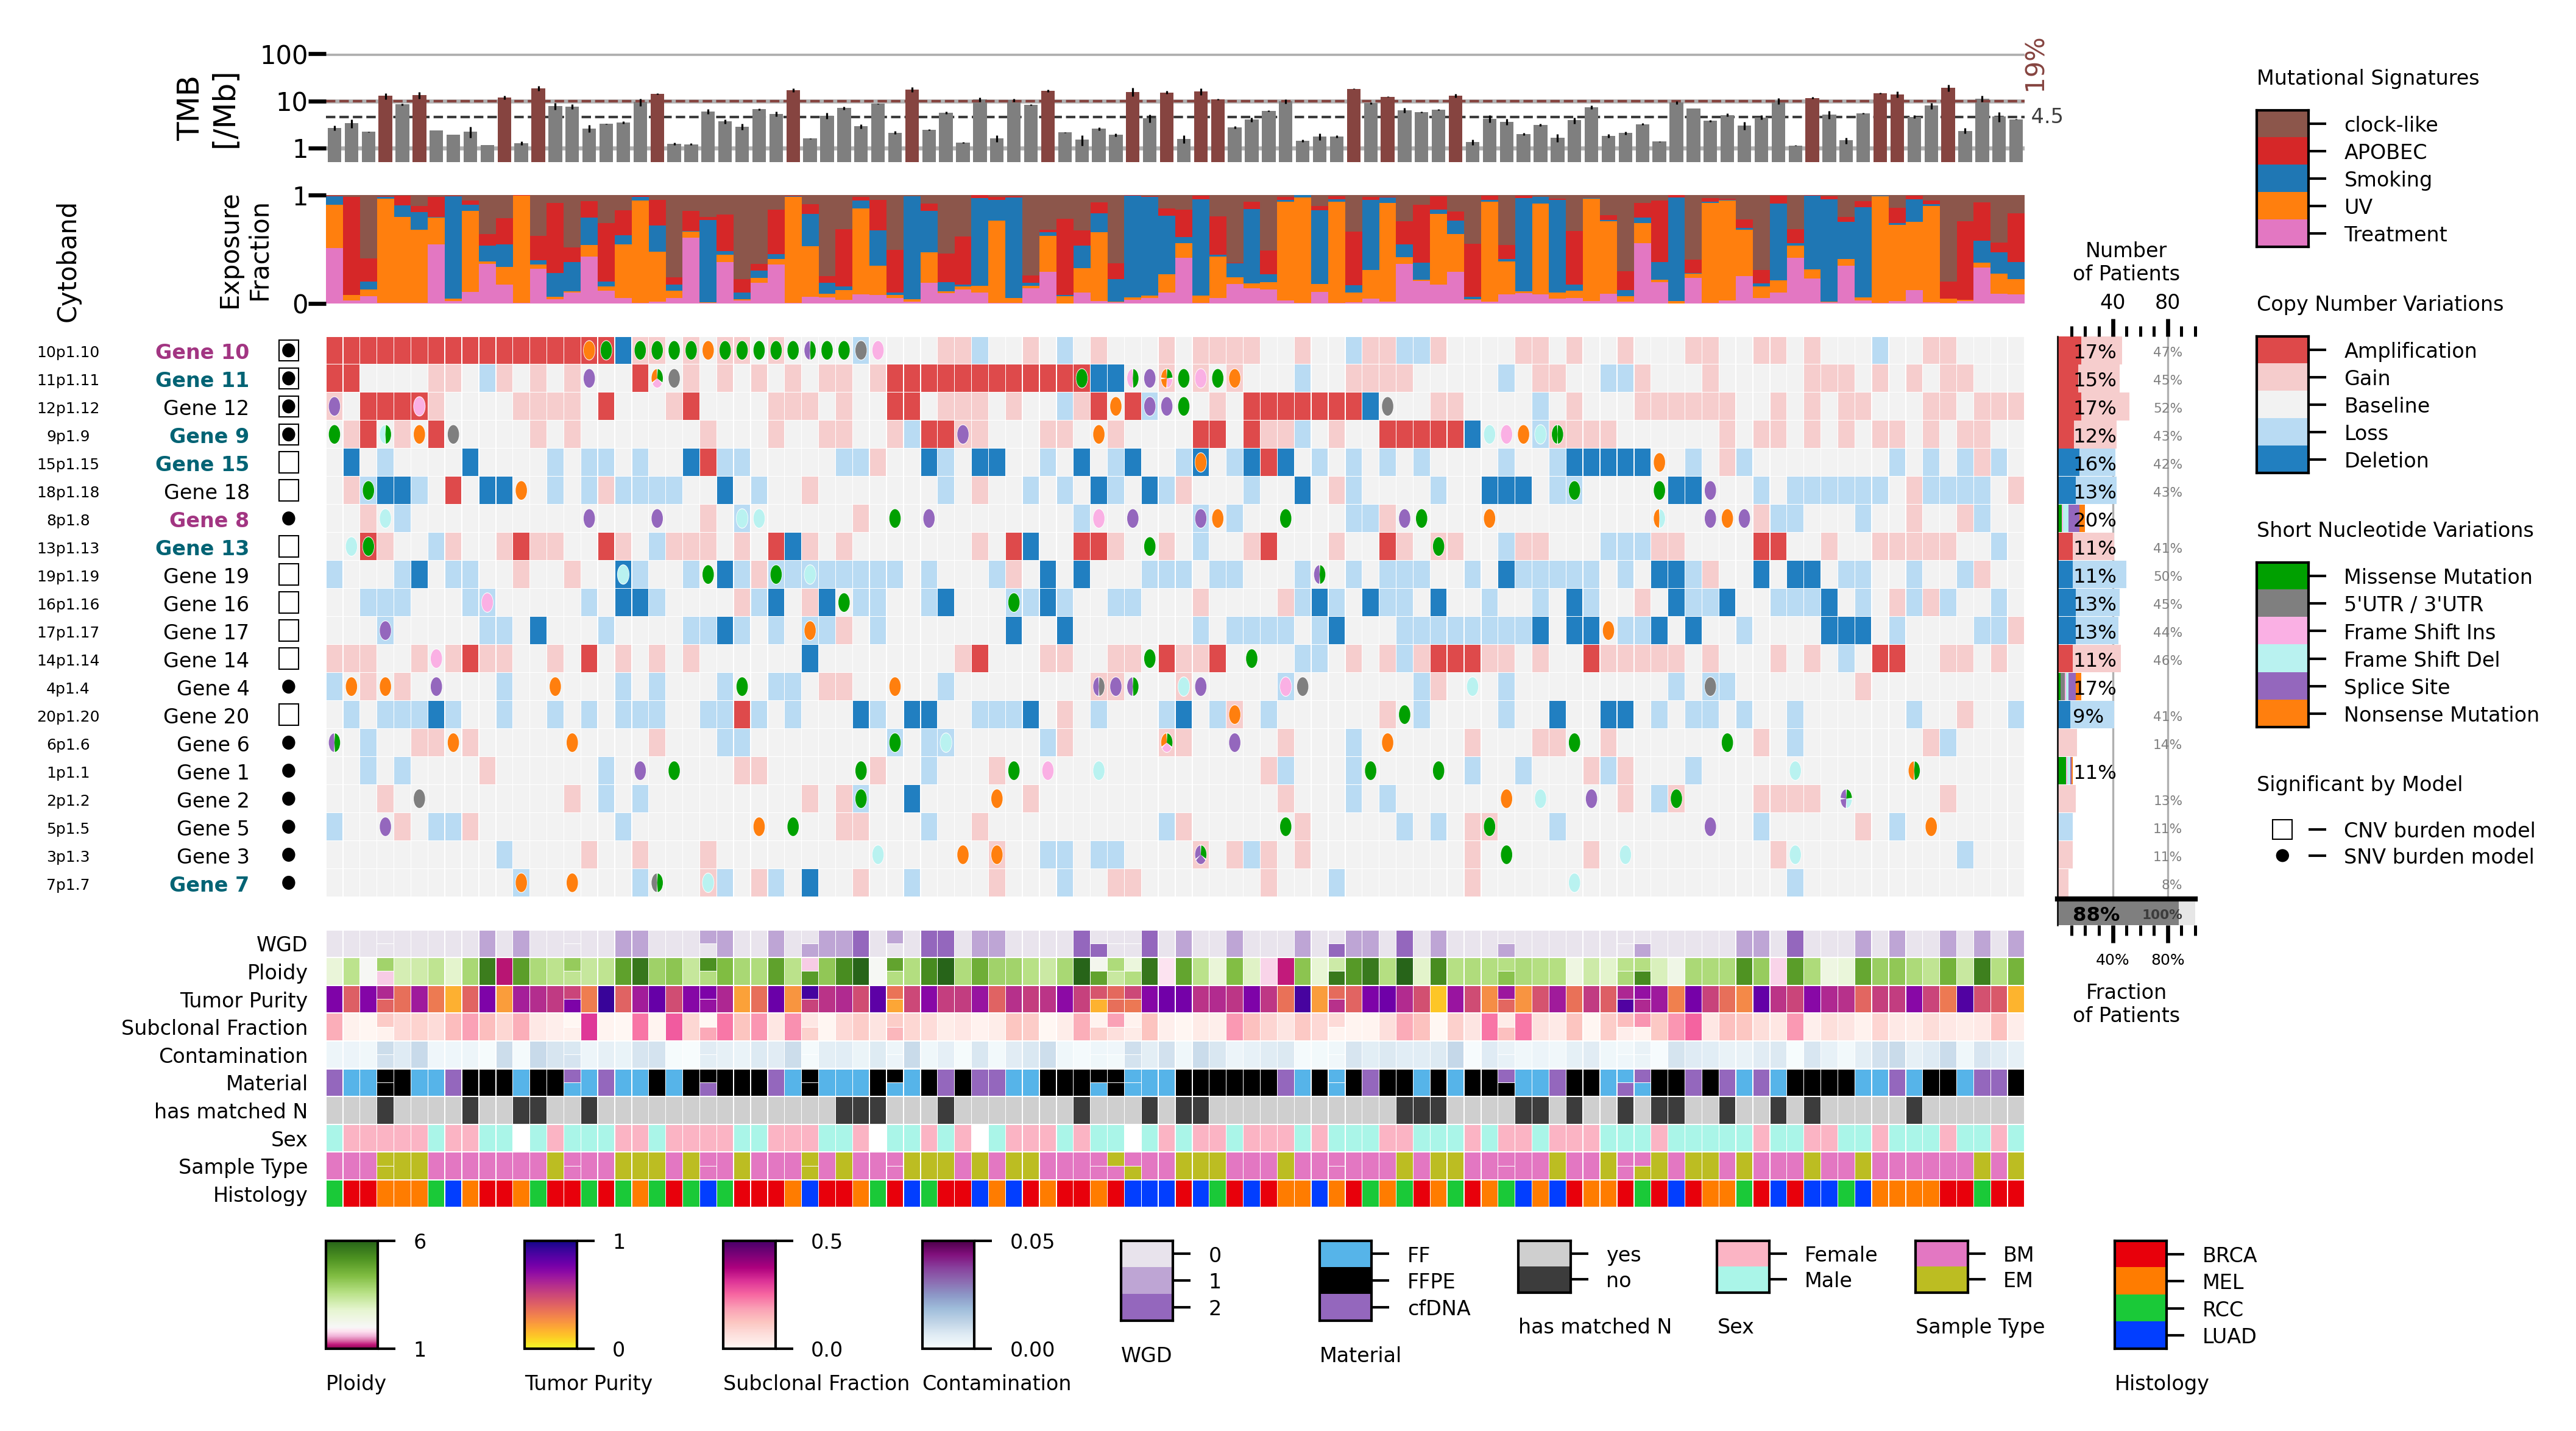
This comutation plot (central panel) visualizes the mutation landscape across a patient cohort. Rows represent genes, and columns correspond to patients. Each cell indicates a gene’s mutation status in a patient: rectangles denote copy-number variations (CNVs), and ellipses indicate short nucleotide variations (SNVs), with multiple SNVs shown as subdivided wedges. Colors encode mutation types and functional effects.
The top panel displays tumor mutation burden (TMB) per patient, with high TMB (≥10/Mb) highlighted in red. The mutational signature panel shows the relative fraction of exposures to different mutational signatures for each patient or sample. The left panel summarizes mutation recurrence, showing SNV and CNV frequencies per gene, annotated with recurrent protein alterations. It also reports the percentage of patients with high-level CNVs, supplemented by low-level CNVs in brackets, along with the total percentage of patients carrying either an SNV or a high-level CNV in the gene.
The bottom panel presents patient- and sample-level metadata. For patients with multiple samples, metadata cells are subdivided accordingly.
✔ Visualizes SNVs and CNVs in a single plot
✔ Summarizes mutational burden, recurrence, and metadata
✔ Customizable layout and annotation
✔ Compatible with MAF, GISTIC, and SIF files
✔ Integrates with GATK Funcotator, GISTIC 2.0, and other genomic tools
To install ComutPlotLib, run:
pip install -r requirements.txtAlternatively, use the provided installation script:
bash install.sh
Run ComutPlotLib with:
python comut_argparse.py --output output_plot.png --maf input.maf
For a full list of options, use:
python comut_argparse.py --help
📌 For detailed examples, refer to the .
ComutPlotLib requires at least one of the following input files:
- Mutation Annotation Format (MAF):
- Output of GATK Funcotator
- Contains mutation calls and annotations
- GISTIC output:
- From GISTIC 2.0
- Provides copy number alteration calls (file: all_thresholded.by_gene.txt)
Sample information can be provided via
- Sample Information File (SIF):
- Tab-separated metadata file
- Contains sample attributes (e.g., tumor purity, platform, histology)
- See
for required columns
🔬 Try the demo:
- Generate your own synthetic data:
python make_data.py
- Generate a plot
bash call_comut.sh
This will generate an example comutation plot using the synthetic test datasets.
Required dependencies are listed in requirements.txt. Install them via:
pip install -r requirements.txt
Developed by Philipp Hähnel. For questions, send an email.
This project is licensed under the MIT License. See the LICENSE file for details.