-
Notifications
You must be signed in to change notification settings - Fork 43
Appendix F: Frequency response graph interpretation
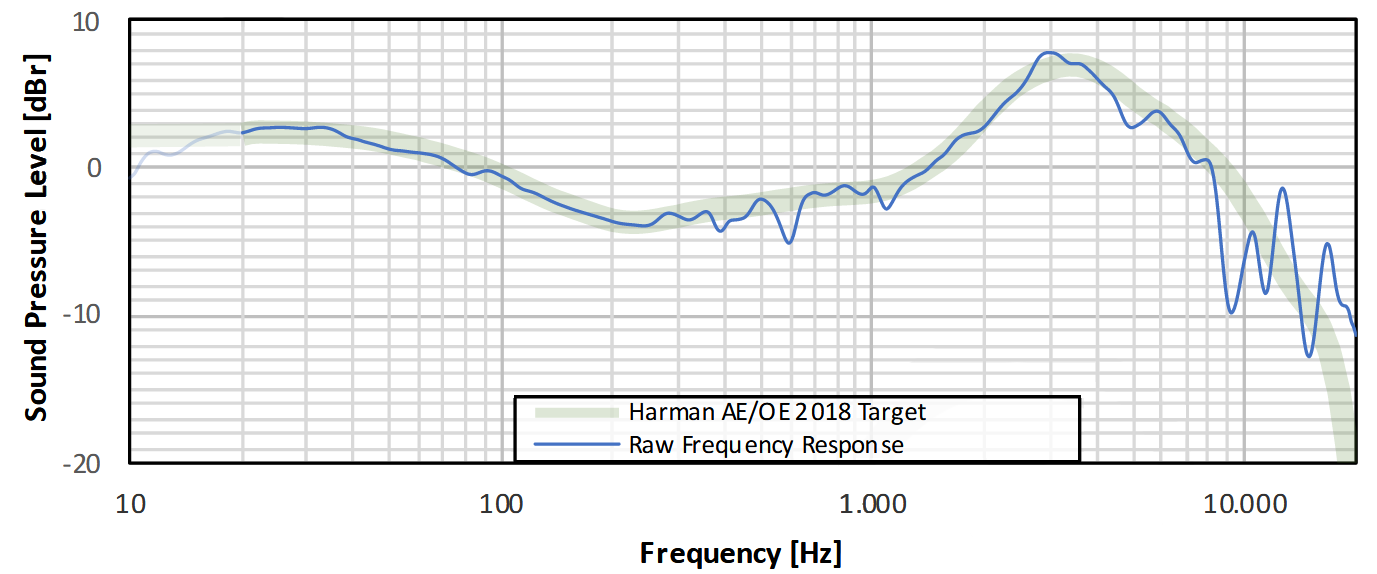
We provide a frequency response measurement here that we believe is representative of the overall sound quality of our Headphones. This appendix will explain what the graph means and what information it includes.
A big thanks to oratory1990 for measuring the Ploopy Headphones!
The equipment used to measure the frequency response of the Headphones is as follows:
- GRAS45BC-10 KEMAR head and torso simulator
- GRAS KB5000/5001 anthropometric pinnae
- APx515 or APx526 Signal Generator/Analyzer
- APx1701 amplifier
We believe that the Harman AE/OE 2018 Target represents an ideal sound for headphones, and have tuned the headphones to be close to this target.
The Ploopy Headphones deviate from the Harman Target by an average of 0.66 dB.
According to S. Olive et al.'s "A Statistical Model That Predicts Listeners' Preference Ratings of In-Ear Headphones" study, this deviation means that the Ploopy Headphones have a preference score of 93/100.
oratory1990's full report on the Ploopy Headphones is available here.
Copyright (C) 2023 Ploopy Corporation. Permission is granted to copy, distribute and/or modify this document under the terms of the GNU Free Documentation License, Version 1.3 or any later version published by the Free Software Foundation; with no Invariant Sections, no Front-Cover Texts, and no Back-Cover Texts. A copy of the license is included in the section entitled "GNU Free Documentation License".