Is there a way to fix bar height of horizontal bar charts in R Plotly? #1993
Description
Not too sure if this question is asked before. I have been trying to look for solutions but to no avail.
I am trying to create a shiny dashboard with plotly. The thing is that I have earmarked a fixed space for the chart. And in this chart, it is a horizontal bar charts for many category.
Here is the minimally reproducible code.
library(tidyverse)
library(plotly)
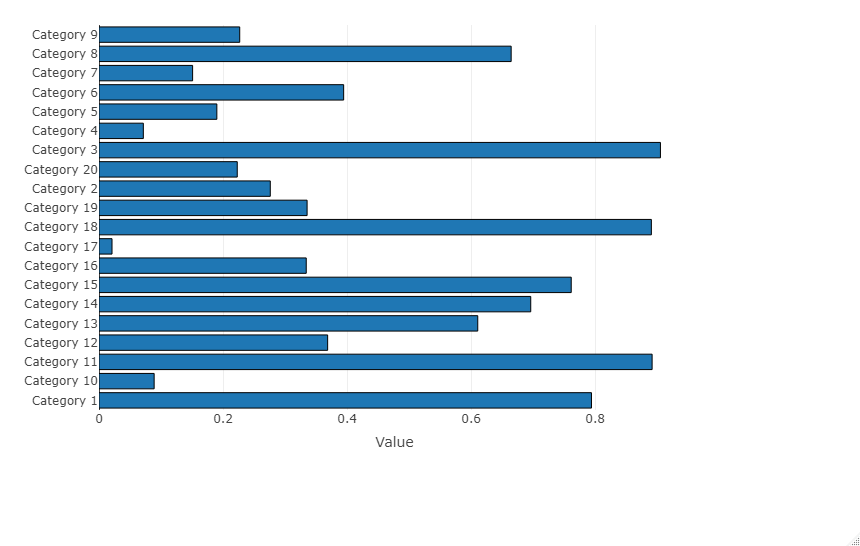
tibble(Category = str_c("Category ", seq(1, 20, 1)),
Value = runif(20)) %>%
plot_ly(
y = ~ Category,
x = ~ Value,
type = "bar",
hoverinfo = "text",
hovertemplate = ~paste0(
"Category: ", Category, "<br>",
"Value: ", Value,
"<extra></extra>"
),
marker = list(
line = list(color = "#000000",
width = 1)
)
) %>%
layout(
autosize = FALSE,
showlegend = FALSE,
xaxis = list(
title = "Value"
),
yaxis = list(
title = ""
)
) The issue is that sometimes the number of categories varies. It can be 20 in this case, it can go up to 100.
What I would like to have is to fix the height of the horizontal bar regardless of the number of categories. So if there are more categories, the height of each bar will stay constant and the vertical scroll will appear to accommodate the extra bars.
So far the solution prescribed online is to write a fixed formula for height and let Plotly auto-size itself. I took the cue from this site.
https://community.plotly.com/t/how-to-add-vertical-scroll-bar-on-horizontal-bar-chart/12342/2
The work-around suggests writing a formula on height based on the fixed formula
plot_height <- 500 + 10*nrow(df)
But this is not ideal. Sometimes I have only 1 category and the bar height is excessive. Sometimes I have 1000 categories and each of them looks like a stick.
I don't know. I thought having a fixed bar height for horizontal bar charts should be something quite fundamental, but it turns out exceedingly hard in Plotly.
Would appreciate any suggestions here.