-
-
Notifications
You must be signed in to change notification settings - Fork 1.9k
Closed
Labels
bugsomething brokensomething broken
Description
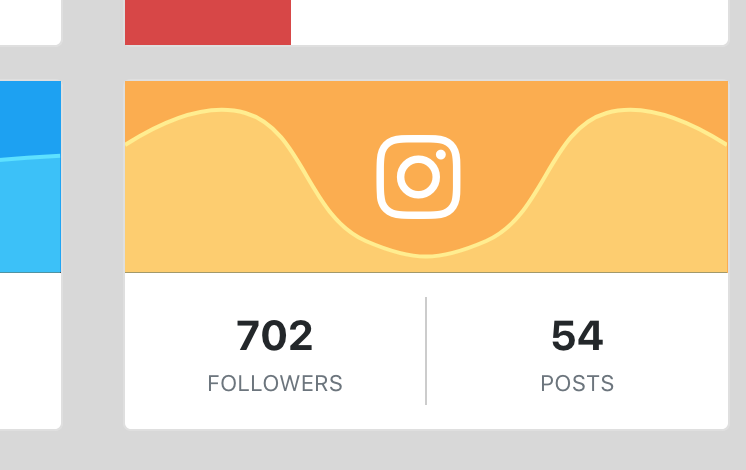
Hi, I cannot (don't know how to) remove the borders around the plot.
Here is my code, along with the screenshot (faking an instagram stat widget for an admin gui),
and we can see the small black-ish border between the top yellow part and the bottom white part, is there a way to remove it?
<div class="col-sm-6 col-lg-3 mb-3">
    <div class="card social-card">
        <div class="card-header bg-instagram">
            <i class="fab fa-instagram"></i>
            <div class="plot" id="plot-instagram-1"></div>
            <script>
                var trace1 = {
                    x: [1, 2, 3, 4, 5, 6],
                    y: [120, 150, 30, 30, 150, 120],
                    type: 'lines',
                    fill: 'tozeroy',
                    mode: 'lines',
                    line: {
                        color: '#ffed90',
                        shape: "spline",
                        smoothing: 1.3,
                    }
                };
                var data = [trace1];
                Plotly.newPlot('plot-instagram-1', data, {
                    margin: {
                        l: 0,
                        r: 0,
                        b: 0,
                        t: 0,
                        pad: 0,
                    },
                    xaxis: {
                        showgrid: false,
                    },
                    yaxis: {
                        showgrid: false,
                        range: [0, 180],
                    },
                    height: 100,
                    showlegend: false,
                    plot_bgcolor: "#fbad50",
                    paper_bgcolor: "#fbad50",
                }, {
                    responsive: true,
                    staticPlot: true,
                });

            </script>
        </div>
        <div class="card-body">
            <div>
                <div class="text-number">702</div>
                <div class="text-uppercase text-muted small">followers</div>
            </div>
            <div>
                <div class="text-number">54</div>
                <div class="text-uppercase text-muted small">posts</div>
            </div>
        </div>
    </div>
</div>
Metadata
Metadata
Assignees
Labels
bugsomething brokensomething broken
