-
-
Notifications
You must be signed in to change notification settings - Fork 2.7k
Description
I am trying to use plotly's Scatter to plot around 3000 RGB images of size 32x32
(or about 3*32*32*3000=~9 MB of data total).
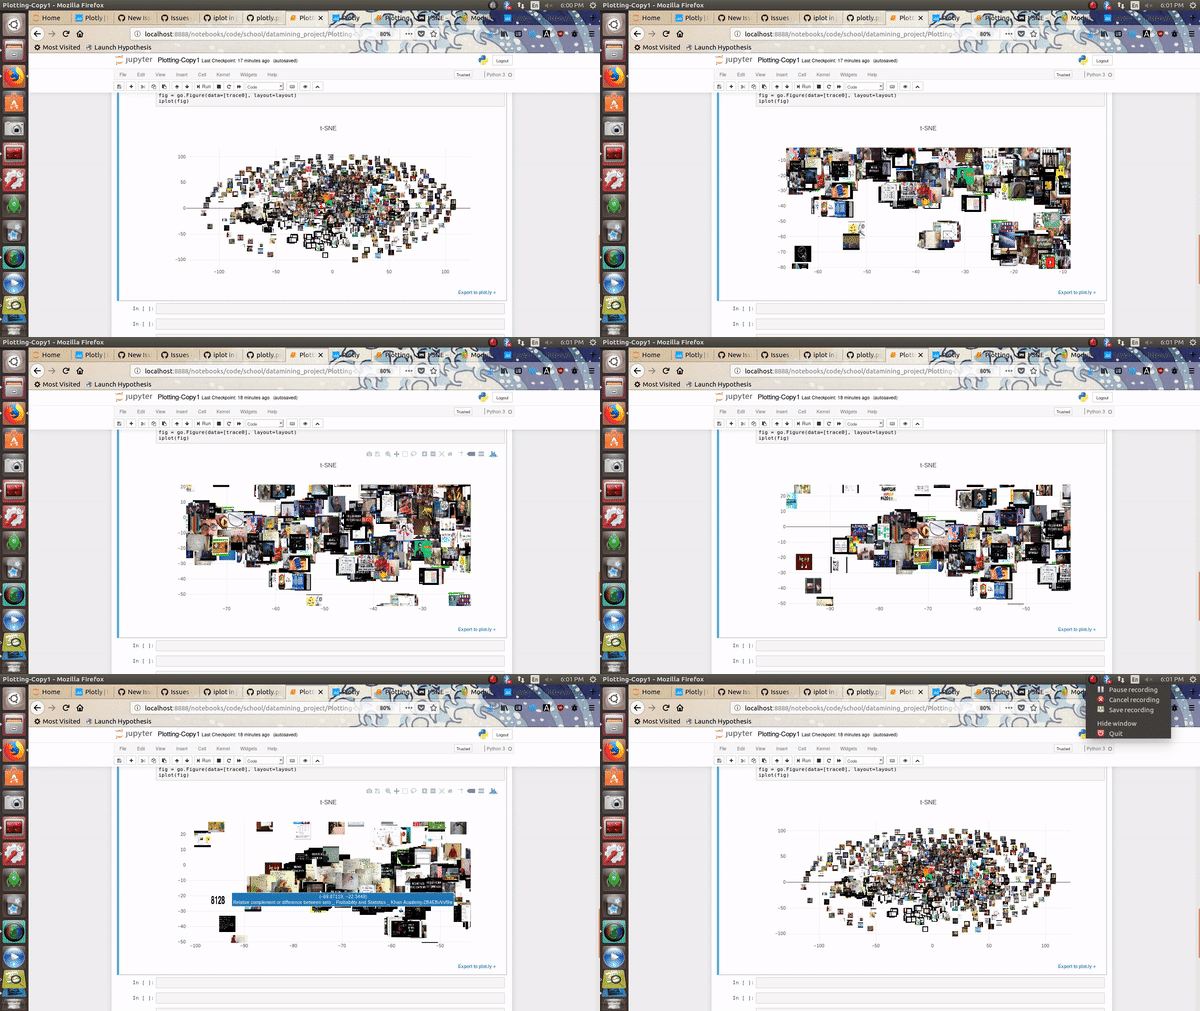
plotly becomes very slow when I try to do this. I don't think this is too much data to display (because D3 examples like this run fine), but the renderer seems to be handling it especially poorly. I recorded a gif (below) of trying to explore the data, and a few things to notice are how it is generally laggy and how during zooming or panning, the images momentarily correspond with the wrong points in the graph. This second point makes me think there is some inefficiency that may be a relatively easy fix to get better performance, but I'm not sure.
Basically, my point in raising this Issue is to ask:
- Is there a different way I should be doing this, that could be added to this documentation? Or is this the best/only way in plotly, and I should use something else for now?
- Are there any plans or could there be plans made to support more performant image displaying?
Thanks! 🙂
Here is the snippet of code that I am using to plot.
from plotly.offline import download_plotlyjs, init_notebook_mode, plot, iplot
import plotly.graph_objs as go
init_notebook_mode(connected=True)


def get_images(path=data_path):
    """return a list of dictionaries for all images"""
    x=X_tsne[:,0]
    y=X_tsne[:,1]
    max_x = np.max(x)
    max_y = np.max(x)

    for i in range(len(x)):
        d = dict(
xref="x",
            yref="y",
            sizex=max_x/10,
            sizey=max_y/10,
            xanchor="center",
            yanchor="middle",
            x=x[i],
            y=y[i],
            source=get_thumbnail_path(i),
        )
        dlist.append(d)

    return dlist

images = get_images()

# plot all points from tsne
trace=go.Scatter(
    x=X_tsne[:,0],
    y=X_tsne[:,1],
    mode='markers',
    marker= dict(size= 14,
                line= dict(width=1),
                opacity= 0.0
               ),
    text=names)

# layout with images, where each image corresponds with a data point
layout=go.Layout(
    images=images,
    title= 't-SNE',
    hovermode='closest',
    showlegend= False
)
fig = go.Figure(data=[trace], layout=layout)
iplot(fig)