BinSize adjustments #813
BinSize adjustments #813
Conversation
|
I like the look! I'll let @dmt0 review the code |
|
I'm not done : ) |
9bfe067 to
1b5ea29
Compare
|
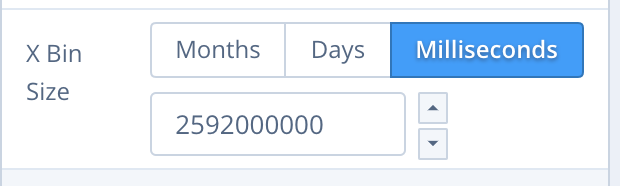
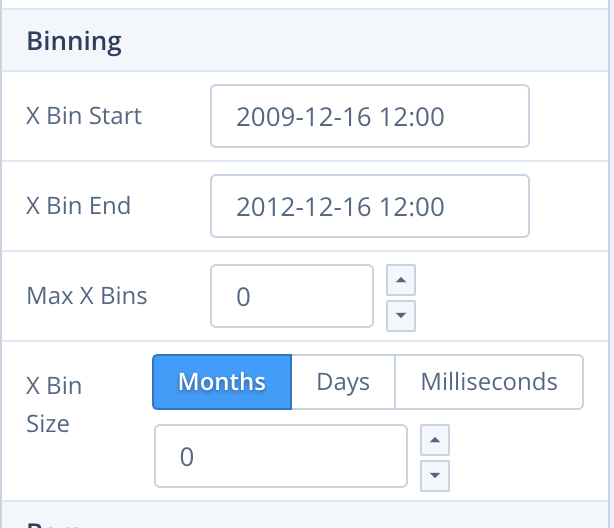
@dmt0 ready for review, would you play around with this one a little and tell me if you find anything weird (@nicolaskruchten if you have a bit of time you too ) Basically, I've chosen to convert everything to the millisecond format in bin.size to simplify conversions, but the approximations I'm making do produce some minor oddities like, going from 12 months to days gives 360 days. Also I've put upper and lower boundaries for the days and months formats. So for days, I put 366, but maybe I shouldn't, (because those could be in other calendars for ex). The percy diff is because I changed max bins and bin size widget's places, because I thought it looked a bit better visually, when the format was date. vs
|
|
Why do you convert the M syntax to millis? My strong instinct is to expose it, as it's a native plotly.js feature. |
Added back the native 'M' support |
|
Code looks fine, but it seems rather odd to me to have this specific subset of timeframes, I think users would find years useful for sure. Hours, minutes and seconds too. Also if we are working with months, a month really can't be assumed to be 30 days. I think it makes sense to go through the trouble of doing things moment.js way. Convert things to moment and use those functions to add months. |
|
@dmt0 plotly.js natively supports e.g. M3 to mean "3 months" no matter which months they are, so we need to expose that. Days is useful, and millisecond precision is supported, so we may as well include it. Years are just M12 or M24 etc. I could see a case for minutes. |
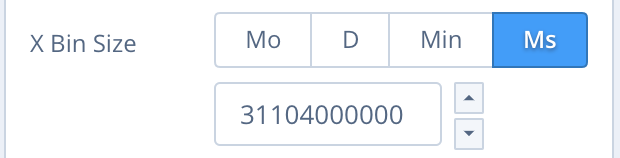
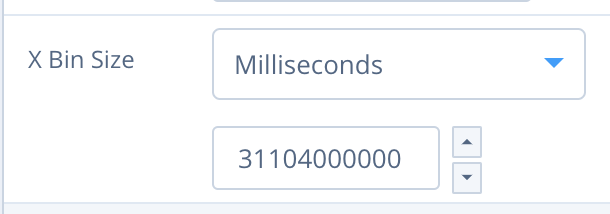
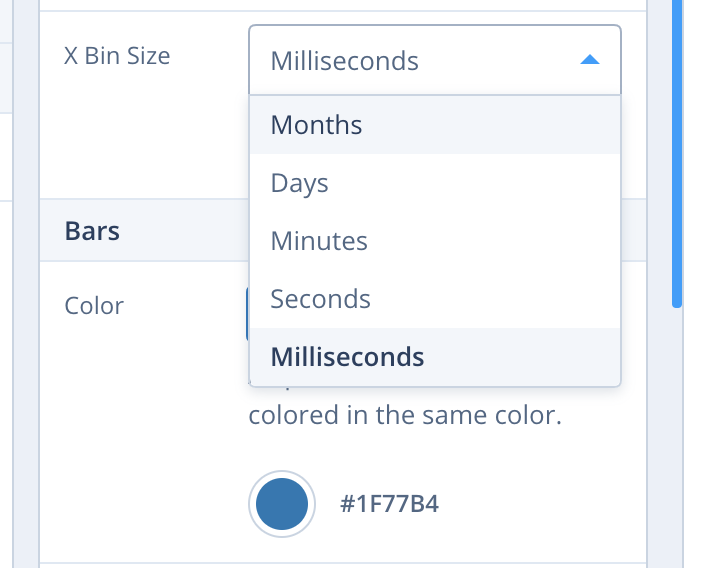
ok given above, I've removed the I can add minutes, it will look like so: |
|
|
|
|
I know that a year is just 12M, but I think it's good to include it in the dropdown |
|
💃 |
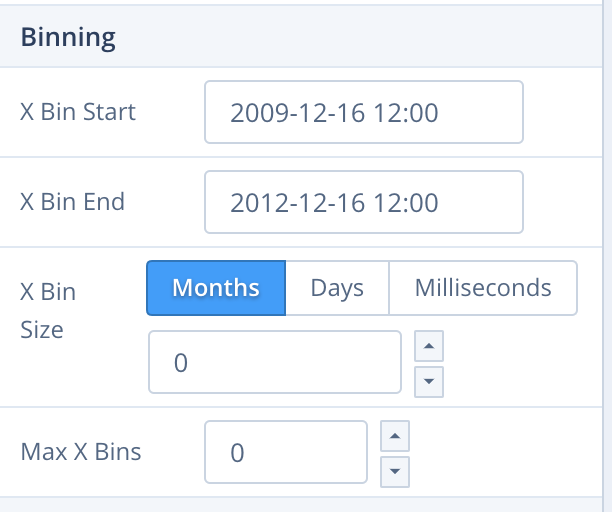
So that it becomes this widget when axis type is date: