Clipped labels of colorbar or longitude/latitude #308
Description
Description
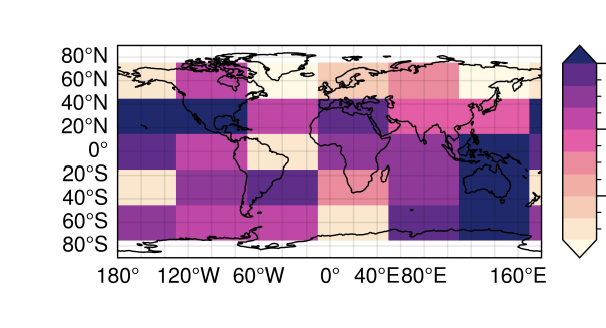
Either the colorbar or lon/lat labels are clipped. Maybe something is wrong in the modification of tight.
Steps to reproduce
import proplot as pplt
import numpy as np

# Fake data with unusual longitude seam location and without coverage over poles
offset = -40
lon = pplt.arange(offset, 360 + offset - 1, 60)
lat = pplt.arange(-60, 60 + 1, 30)
state = np.random.RandomState(51423)
data = state.rand(len(lat), len(lon))

# Plot data both without and with globe=True
fig, ax = pplt.subplots(proj='pcarree', tight=False)
m = ax.pcolor(lon, lat, data, cmap='sunset', extend='both')
fig.colorbar(m, loc='r', label='values', extendsize='1.7em')
fig.format(coast=True, lonlines=20, latlines=20, labels=True,)

fig.savefig('test.jpg')
Expected behavior: [What you expected to happen]
All labels are shown correctly.
Actual behavior: [What actually happened]
tight=False
tight=True

Proplot version
Paste the results of import matplotlib; print(matplotlib.__version__); import proplot; print(proplot.version)here.
3.5.0
0.9.5.post105