Data sources graph
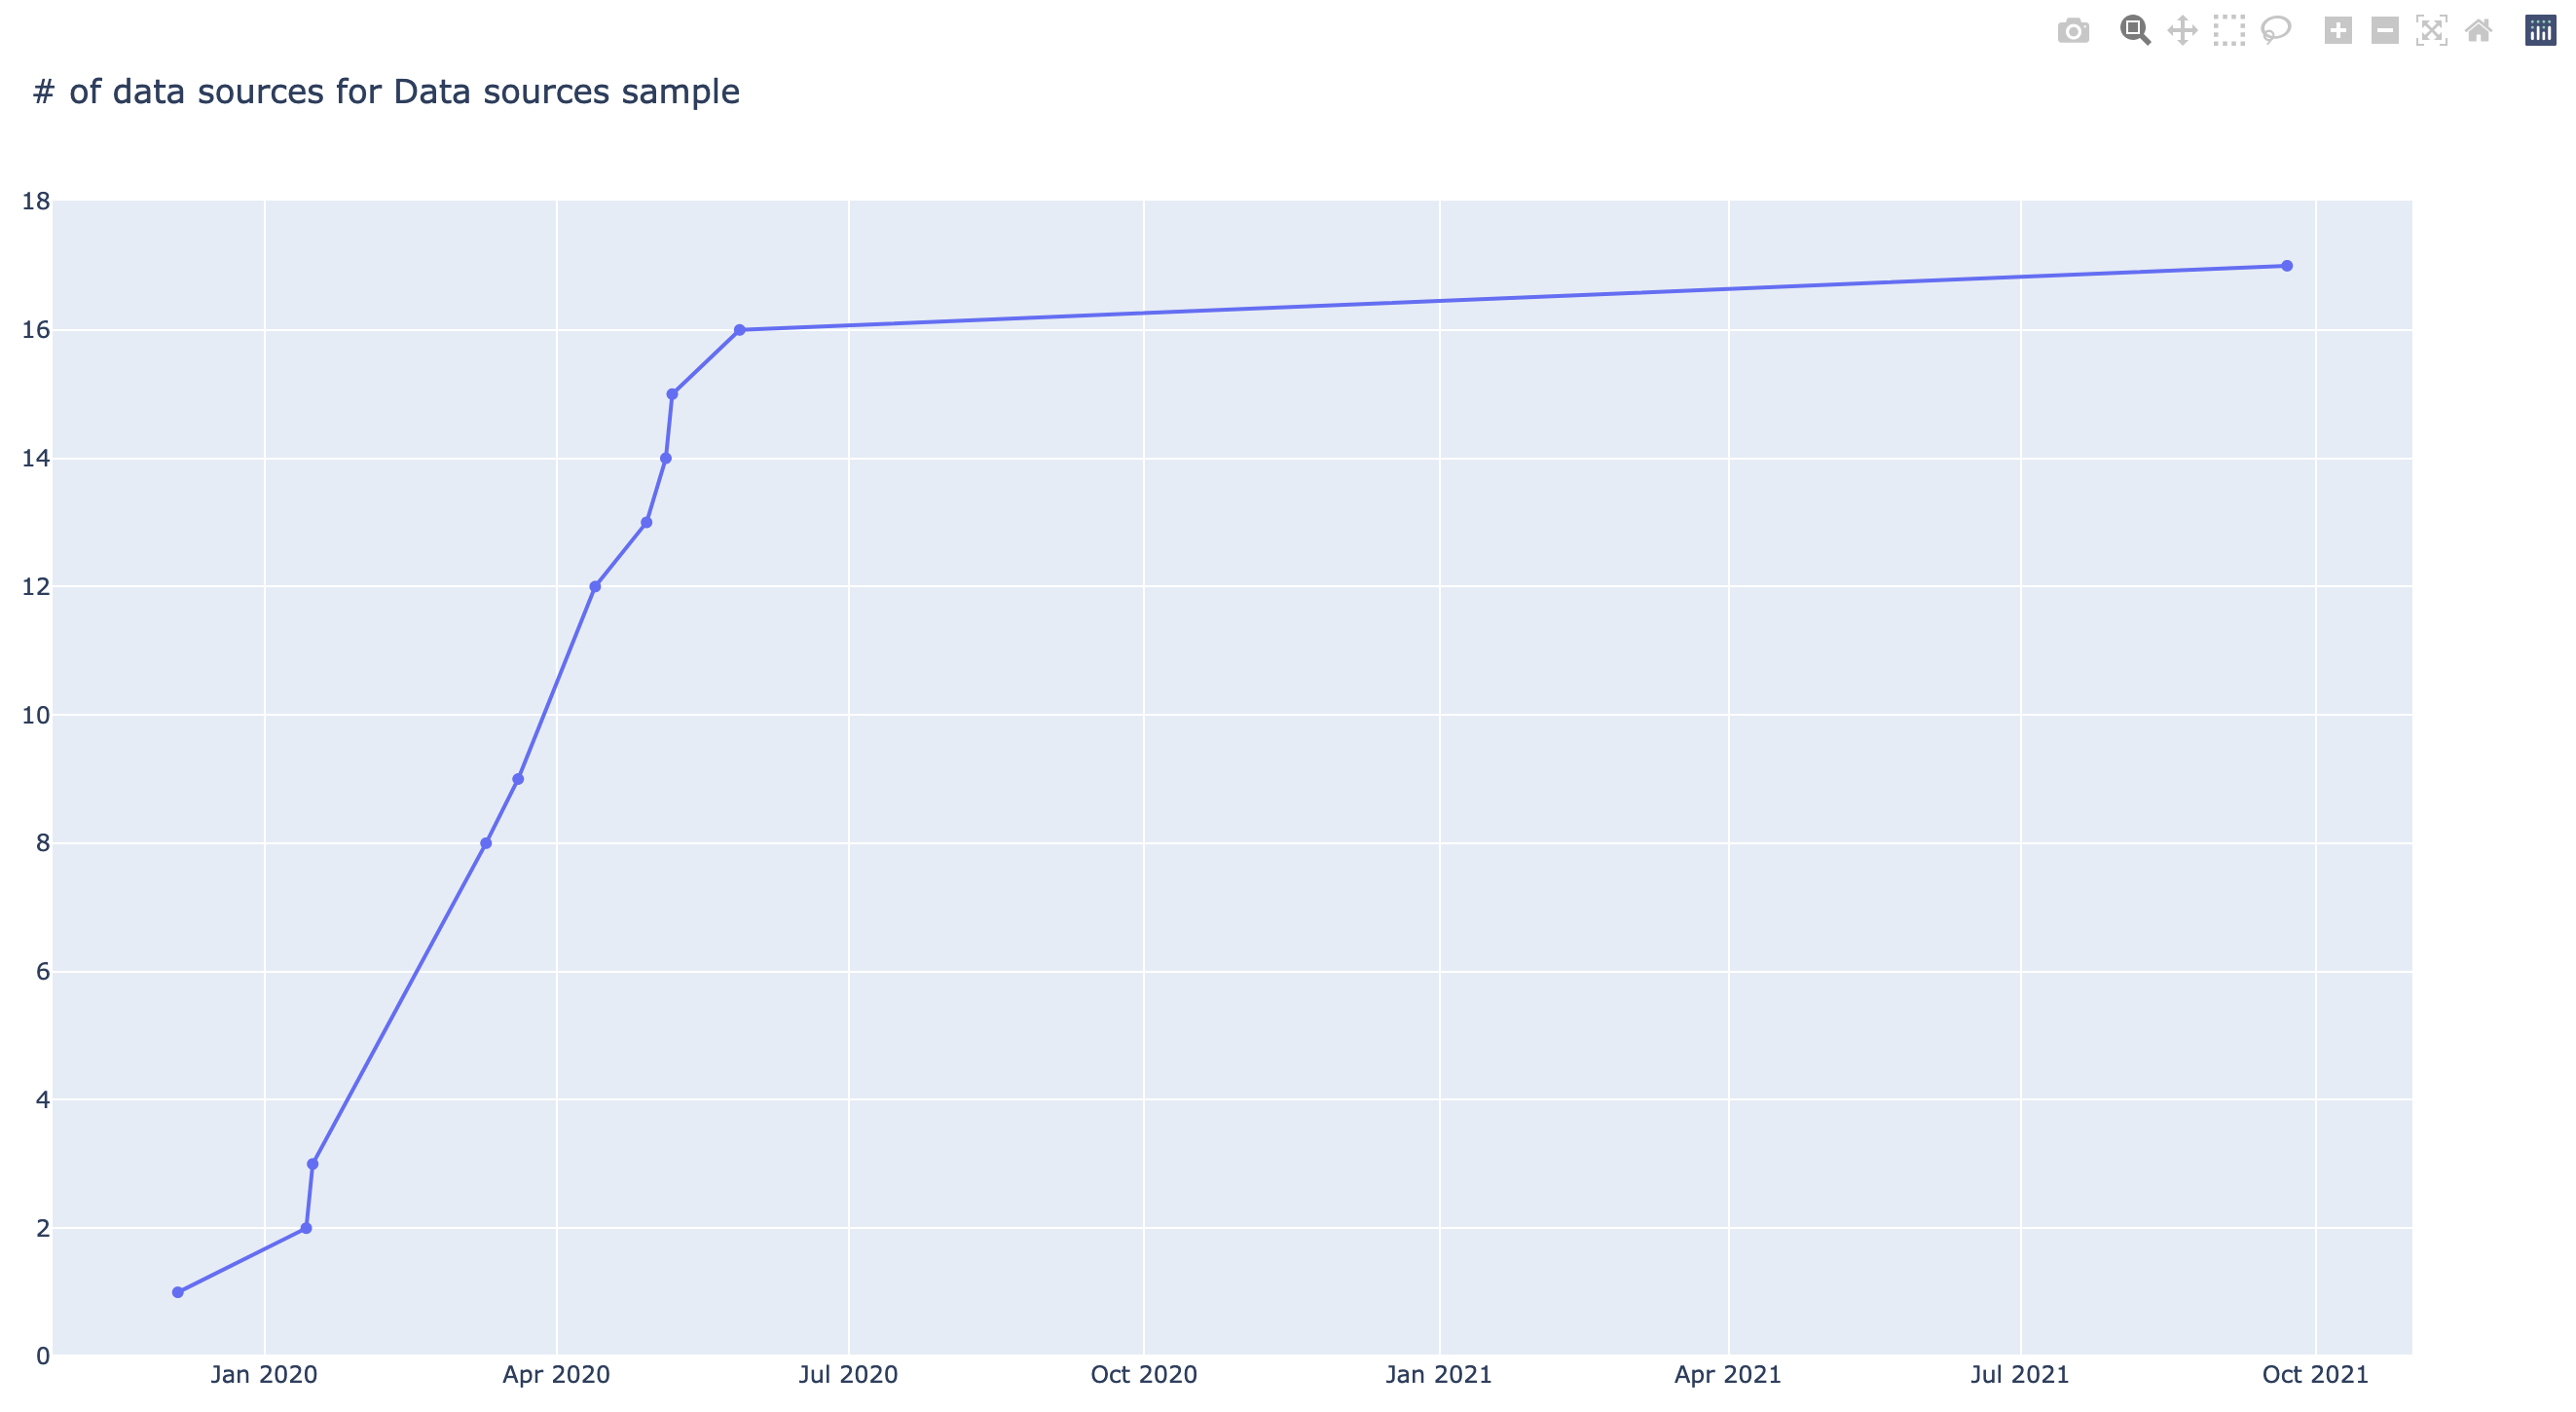
Your data sources are always in motion. The number of data sources are growing, new products appear, more sources are connected to your security data lake, etc. DeTT&CT can generate a graph with the number of added data sources plotted through time to keep track of this development.
To generate a graph based on the data sources administration file, you can run the below command. Showing the improvement (also for visibility or detection) within an MITRE ATT&CK Navigator layer is also possible. An example on how to do this for detection can be found here. The approach on how to do this for data sources is very similar.
python dettect.py ds -fd sample-data/data-sources-endpoints.yaml -g