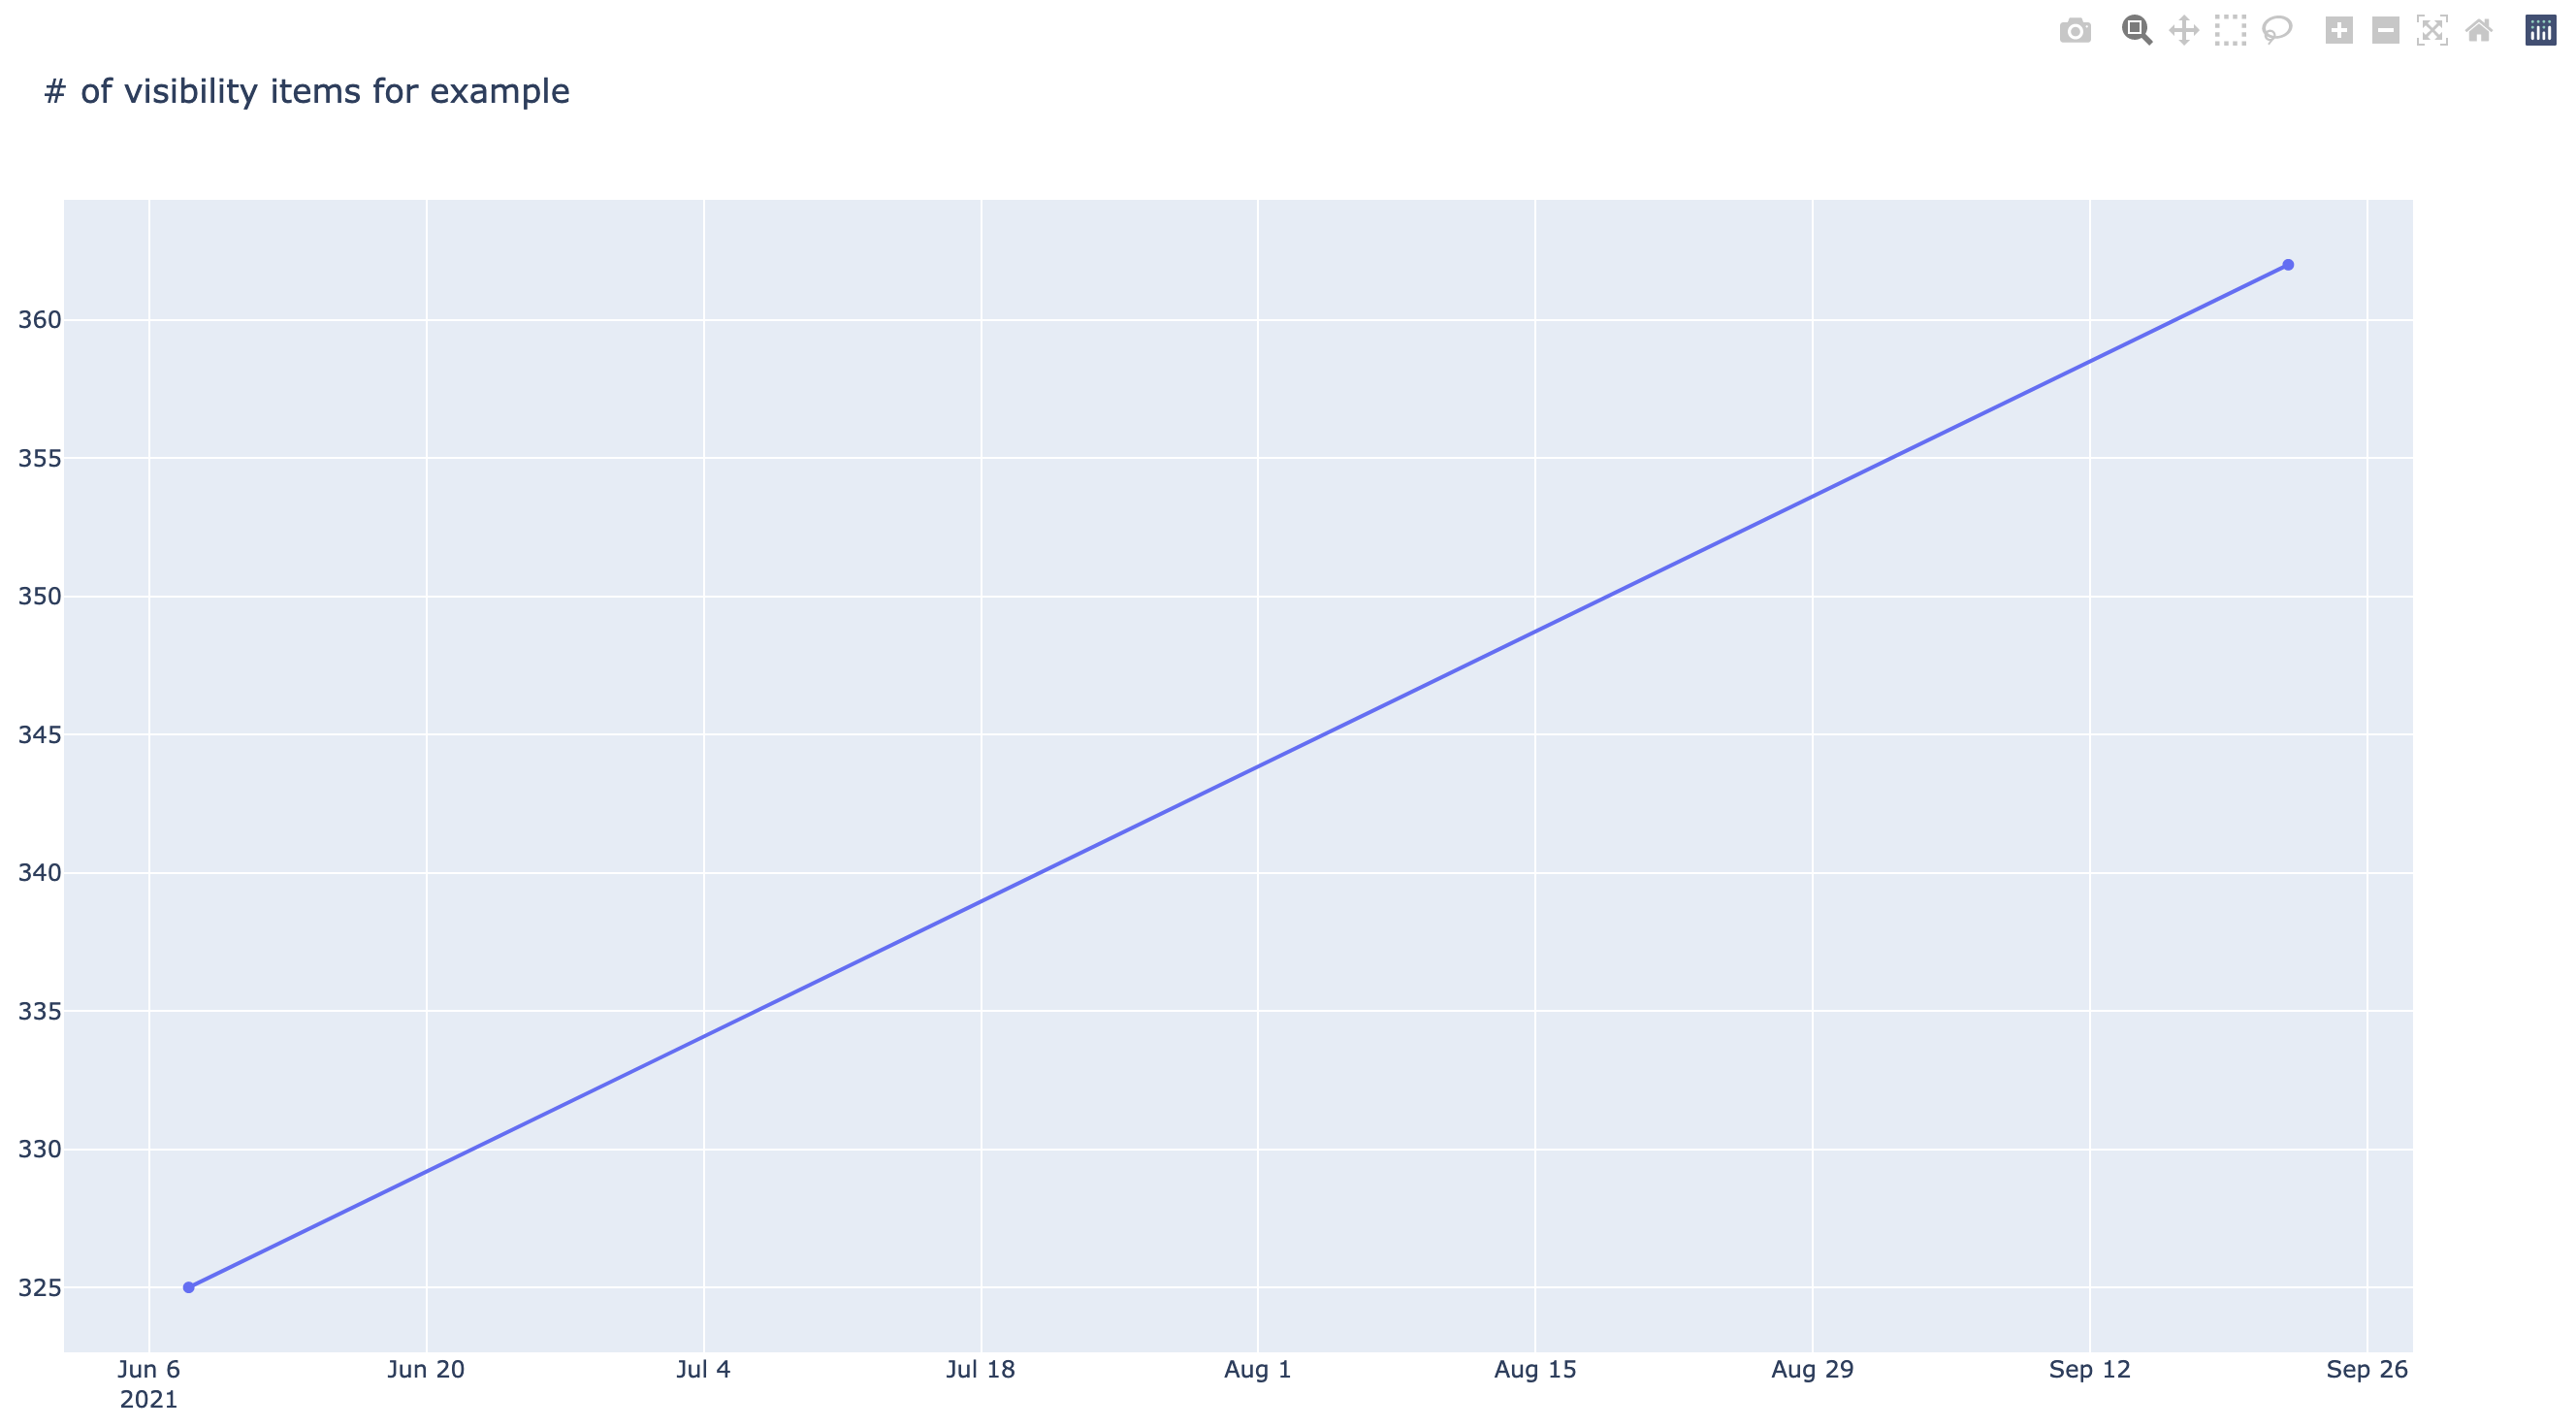
Visibility graph
You can use the recorded dates for visibility objects to generate a graph on the visibility objects added through time.
To generate a graph based on the techniques administration file, you can run the below command. Showing the improvement (also for detections) within a MITRE ATT&CK Navigator layer is also possible. More info can be found here.
python dettect.py v -ft sample-data/techniques-administration-endpoints.yaml -g