Displays an outline as a tree chart.
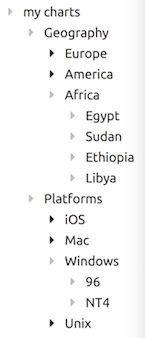
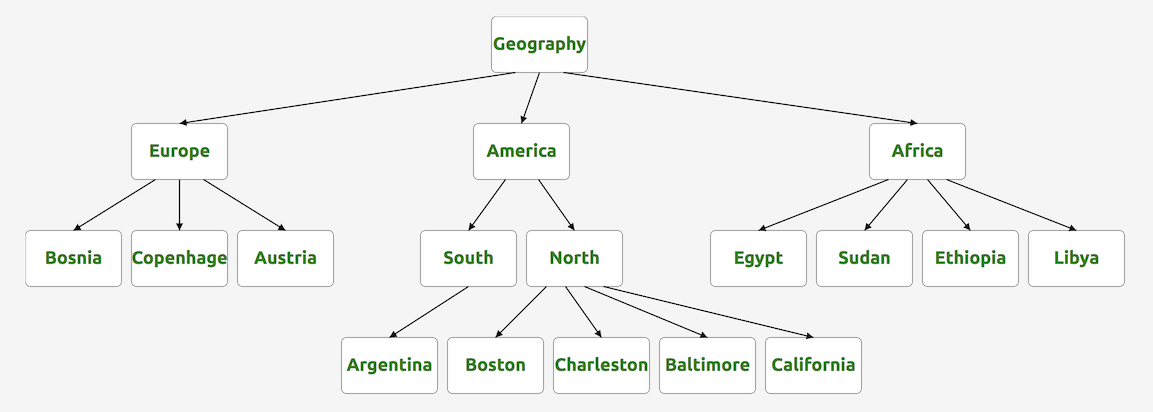
Here's an outline, and a tree chart rendering of the outline.
To get started, click this link to run the Tree Chart app in your browser.
When it opens there will be a chart showing different kinds of computers, organized by the operating systems they run. It's just an example to show how it works.
If you choose a different name from the Charts menu, it will show that chart.
So that's basically what it does, shows you a tree chart.
I used Drummer to edit the outline behind the chart.
Click this link to see the outline in read-only mode in Drummer.
Here's a video that gives you an idea of how editing a tree chart in Drummer works.
This is how you make an outline to ve viewed as a tree chart.
-
Think of what you want the outline to be about. Possibly a list of places you've visited, people you know, favorite sports teams, performers, schools.
-
Create a new outline using the New command in the File menu.
-
Enter your outline. One main head, with several subs, and possibly other subs below the subs.
-
On the top node in the outline, add a type attribute with the value treechart
-
Make the outline public, noting the URL that's assigned to the outline. You'll need it in the next step.
-
With the URL of the outline on the clipboard, enter this URL in the address bar of your browser. Then paste the URL of your outline after the = sigh and press Return.
-
A tree chart view of your outline should appear. Now when you make changes to the outline, the changes will quickly be reflected in the tree chart view.
You can change the appearance of your tree chart by adding attributes to the topmost node in the outline, the one with the type attribute of treechart.
For example, if you want the boxes to have a yellow background, you'd add a rectFillColor attribute with the value yellow to the topmost node.
You can change the font size, style, weight, color, and lots of other things.
See the list of the attrbiutes below.
The attributes with their default values and comments.
treeRootPosition: "top" //choices are top, left
rectFillColor: "white",
rectStroke: "black",
rectOpacity: 1,
rectStrokeWidth: 0.4,
rectCornerRounding: 5,
textAnchor: "middle",
textFontFamily: "Ubuntu",
textFontSize: 14,
textLineSpacing: 15,
textFontWeight: "bold", //choices are bold, normal
textFontStyle: "normal", //choices are normal, italic
textColor: "black",
textPadding: 0,
lineStroke: "black",
lineOpacity: 1,
lineStrokeWidth: 1.2,
lineStrokeDashArray: undefined,
lineArrowHeadSize: 10,
lineArrowPosition: "bottom", //choices are top, bottom
lineColor: "black",
treeWidth: 1100,
treeHeight: 700,
-
You can have more than one treechart in an outline. Any headline with a type attribute of treechart is a chart and will appear in the Charts menu in the app.
-
If you access the treechart app without a url parameter, it will show you the example outline as a tree chart.
-
treechart nodes inherit the attributes of their parents, so you can set up defaults in a parent headline, and put some or all of your treechart nodes under that headline, creating a standard style, without having to repeat the styles in each chart. Makes it easy to change a font size, say, for all the charts you have by changing it in one place.
-
Thanks to Jim Blackler for the wonderful treefun package which is what is doing the SVG drawing in this app.
-
This is intended to be demo code for developers to use to start more complete outline rendering tools.
-
Tree charts were a killer feature in MORE 1.1c in 1986. The users loved them. Turning an outline into a visual tree chart helps people see the value of outlining in a new way. We liked to say "The C stands for color!," which was, in 1986 a new feature for graphic computers.
Post questions here.