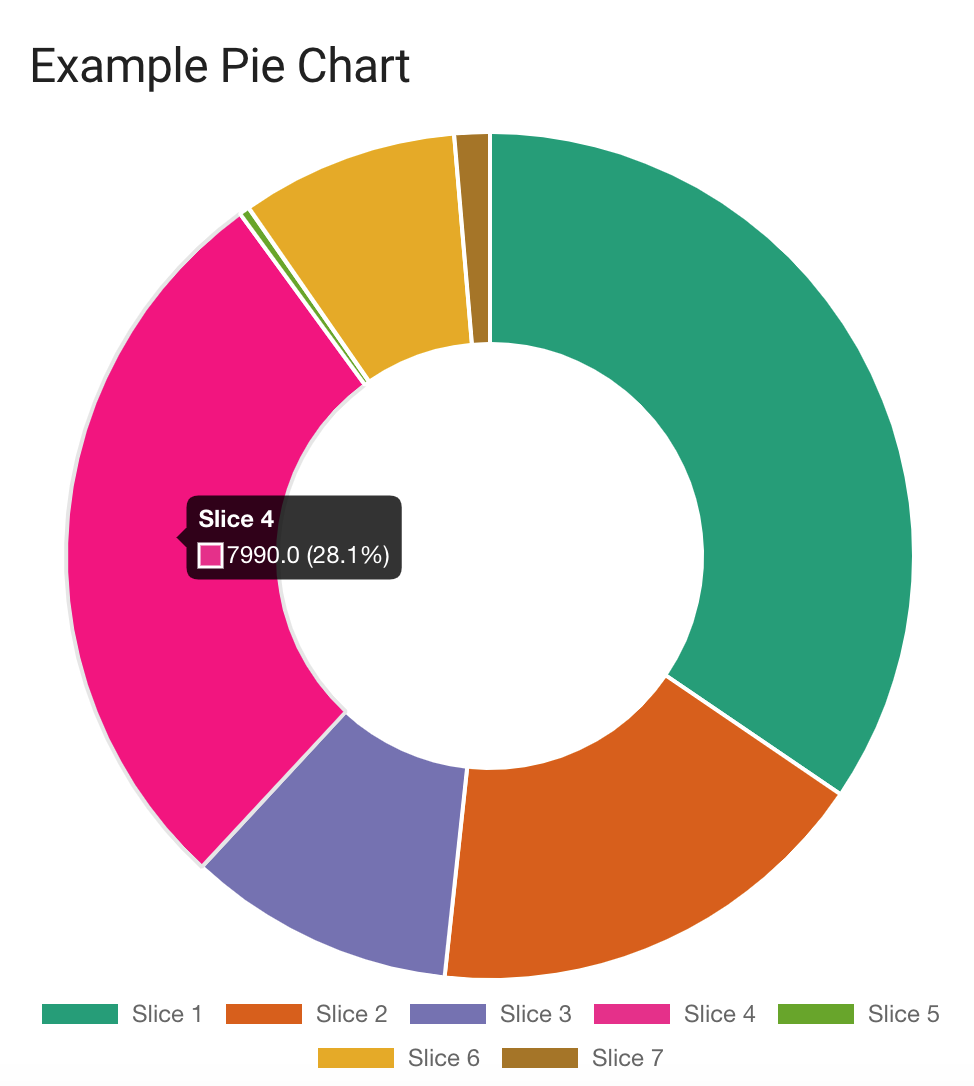
This card will display a doughnut chart based on your specified entities. This was based on https://github.com/cheelio/power-usage-card.
- Add plugin .js as a module:
- url: /local/pie-chart-card.js
  type: module
| Name | Type | Default | Description |
|---|---|---|---|
| type | string |
Required | custom:pie-chart-card |
| entities | array |
Required | A list of Entity objects. |
| title | string |
"Pie Chart" | Title of the card. |
| total_amount | string |
none | Either an entity or number which provides the total value for the pie chart. If provided, then other measured values will be substracted from total to calculate 'unknown' value. |
| unknownText | string |
none | Optional customized unknown text. Only applicable with total_amount option enabled. |
| Name | Type | Default | Description |
|---|---|---|---|
| entity | string |
Required | The entity_id of the entity you want to show. |
| name | string |
friendly_name |
Name to use for entity. If this is not provided, then the entity friendly_name will be used. If the friendly_name does not exist, the actual entity_id will be used. |
- type: "custom:pie-chart-card"
  title: "Example Pie Chart"
  entities:
    - entity: sensor.example_1
      name: Slice 1
    - entity: sensor.example_2
      name: Slice 4
    - entity: sensor.example_3
name: Slice 3- type: "custom:pie-chart-card"
title: "Example Pie Chart"
total_amount: sensor.total_amount
entities:
- entity: sensor.example_1
name: Slice 1
- entity: sensor.example_2
name: Slice 4
- entity: sensor.example_3
name: Slice 3- type: "custom:pie-chart-card"
title: "Example Pie Chart"
total_amount: 10000
entities:
- entity: sensor.example_1
name: Slice 1
- entity: sensor.example_2
name: Slice 4
- entity: sensor.example_3
name: Slice 3- type: "custom:pie-chart-card"
title: "Example Pie Chart"
total_amount: 10000
unknownText: "Missing Value"
entities:
- entity: sensor.example_1
name: Slice 1
- entity: sensor.example_2
name: Slice 4
- entity: sensor.example_3
name: Slice 3