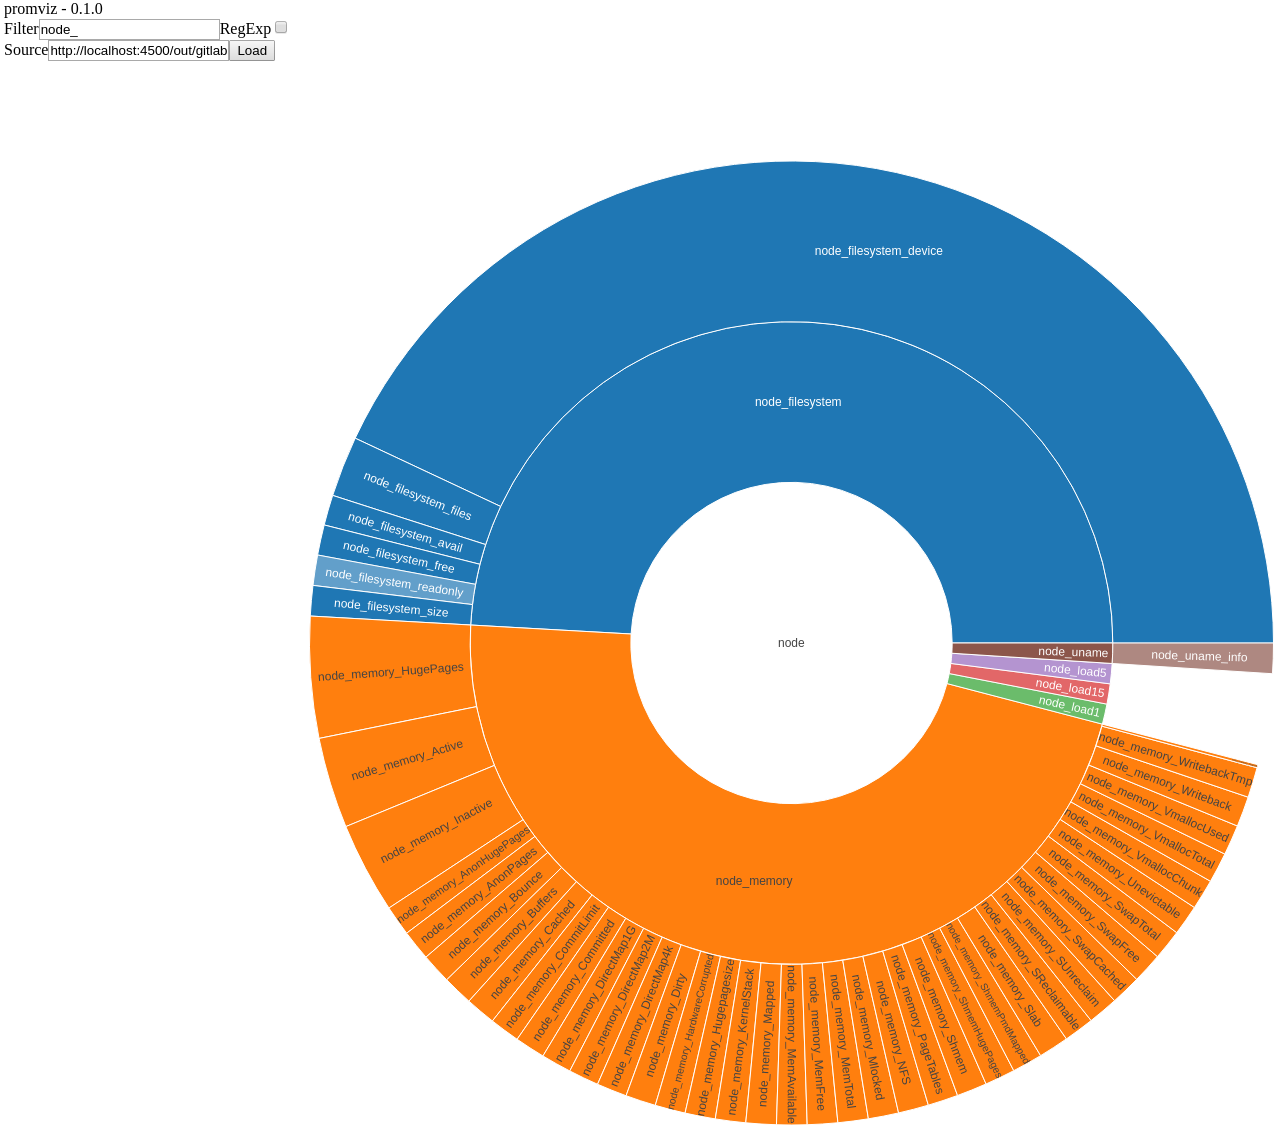
Visualize Prometheus metrics as a sunburst graph, broken down by namespace and subsystem.
This project required the Prometheus SQL adapter schema, which
has been retired, and needs to be updated to work with Prometheus' own /api/v1/labels endpoint.
- clone this repo
- into a gitpod: https://gitpod.io/#https://github.com/ssube/promviz/tree/master
- locally:
git clone git@github.com:ssube/promviz.git
- get some metric names
- run
psql -f scripts/index-names.sqlagainst your Prometheus SQL adapter database - or use the included names from
src/resource/names.json
- run
- build the graph app:
makea bundle- or
Terminal -> Run Task -> Servein gitpod
- serve
out/:SERVE=TRUE make- or
docker run --name promviz-nginx -p 10001:80 -v $(pwd)/out:/usr/share/nginx/html:ro nginx
- navigate to http://localhost:10001/index.html or the gitpod port


