A tkinter based local tool for creating a statistical control chart locally. This is still in development and more features will be added over time including performance improvements via vectorizing many calcualtions, more customization of alert triggers for different data conditions, chart appearance customizations, improvements to the look and feel of the UI, and eventually packaging the tool into a executable.
- Matplotlib
- Numpy
- tkinter
- customtkinter
To run the tool, run the main.py. A packaged executable will eventually be made.
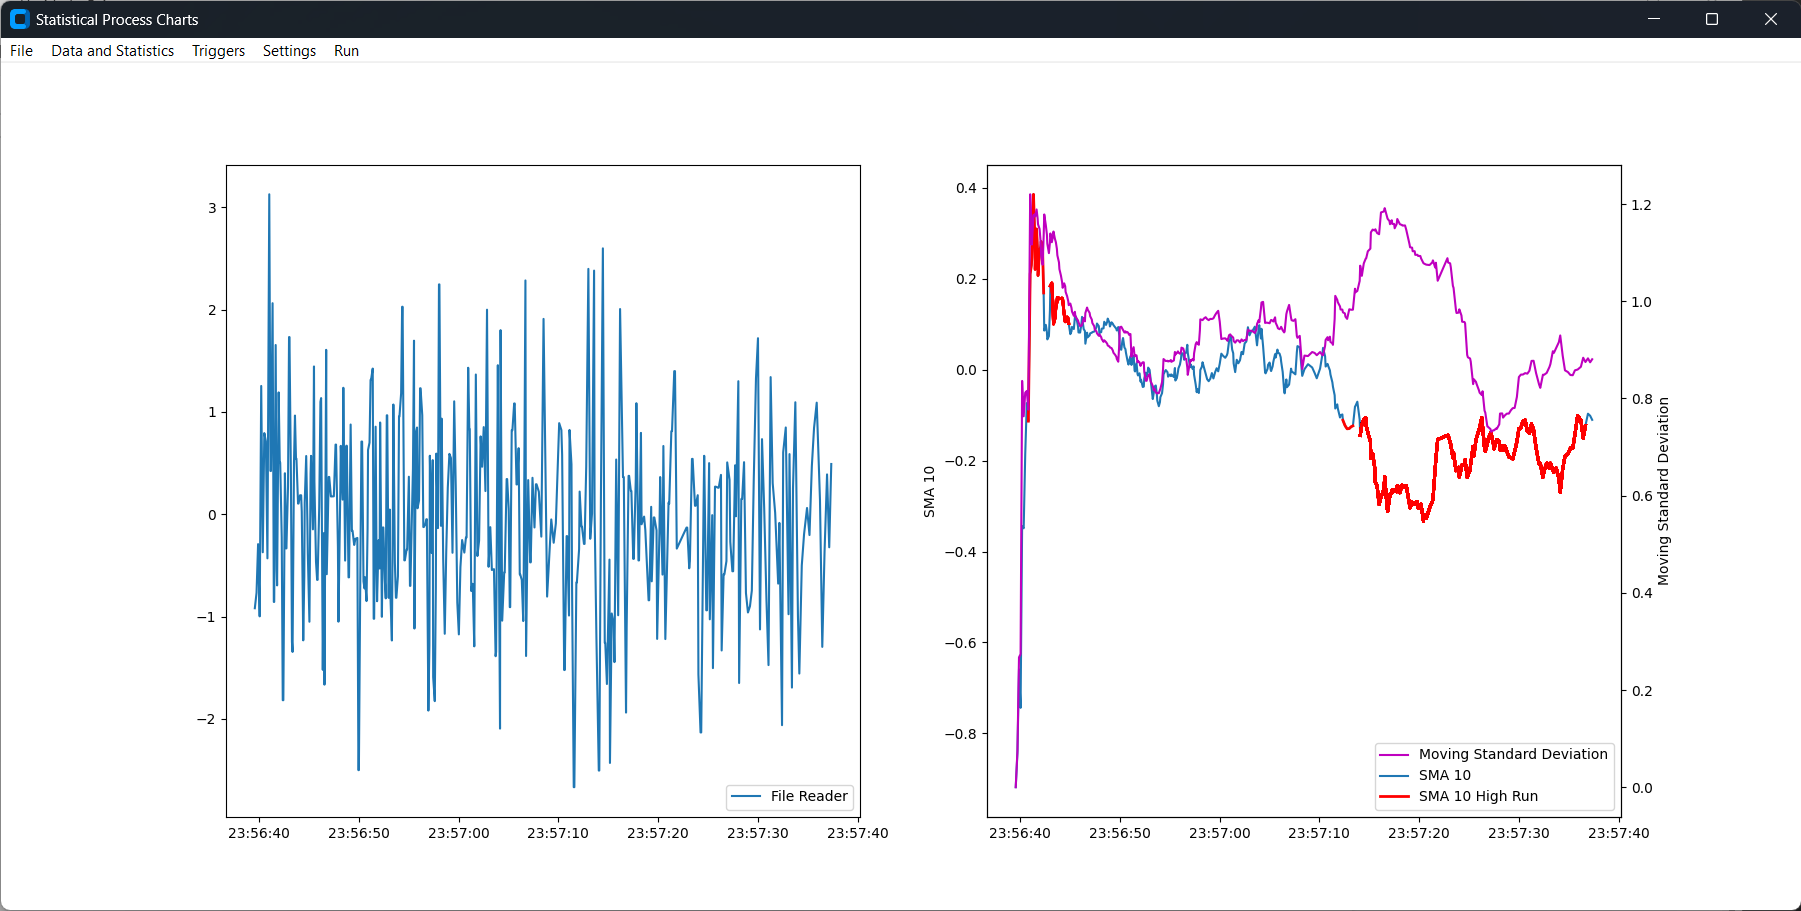
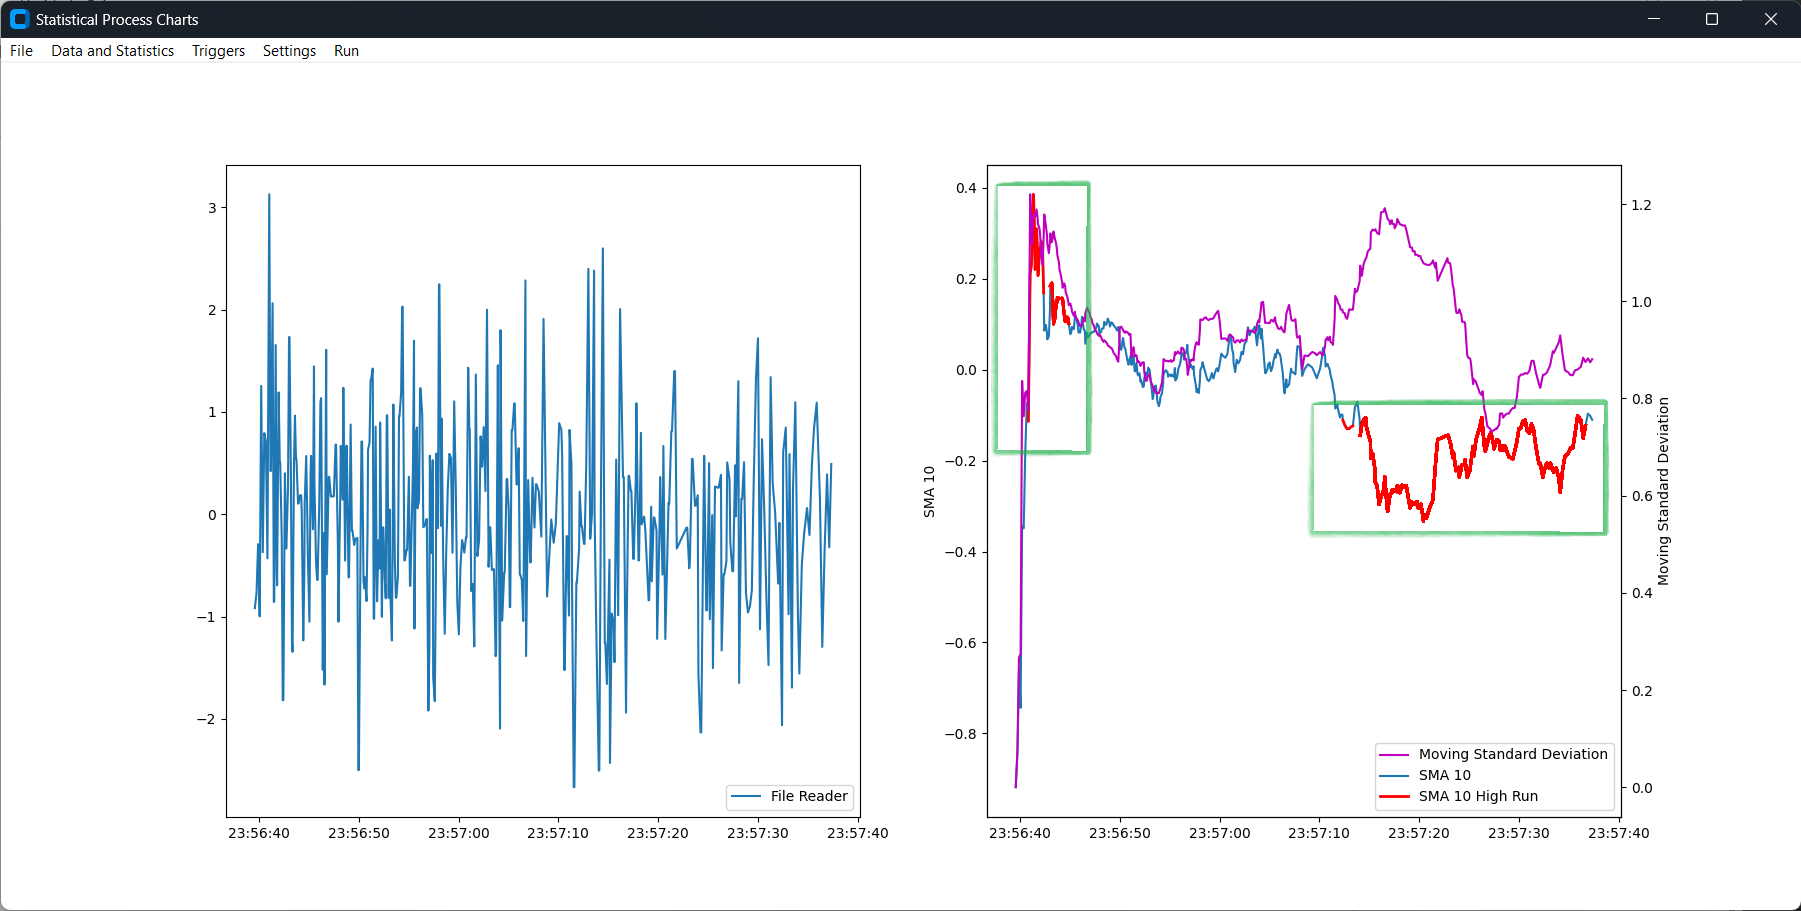
This tool tails a file to repeatedly read the last line as a data stream. From this data stream, user configured statistics can be calculated and data conditions in the raw data stream or in the statistic are flagged and output. The data stream will be plotted in the left graph. test_file_writer.py has been provided to simulate a file being repeatedly written by a data source. The location of the written file is controlled via the TEST_FILE_WRITER_LOCATION field in the config.json file.
To setup a data source a user clicks on the "Data and Statistics" menu and selects the "Data Source Setup" menu option. This will open the Data Source Manangement window.
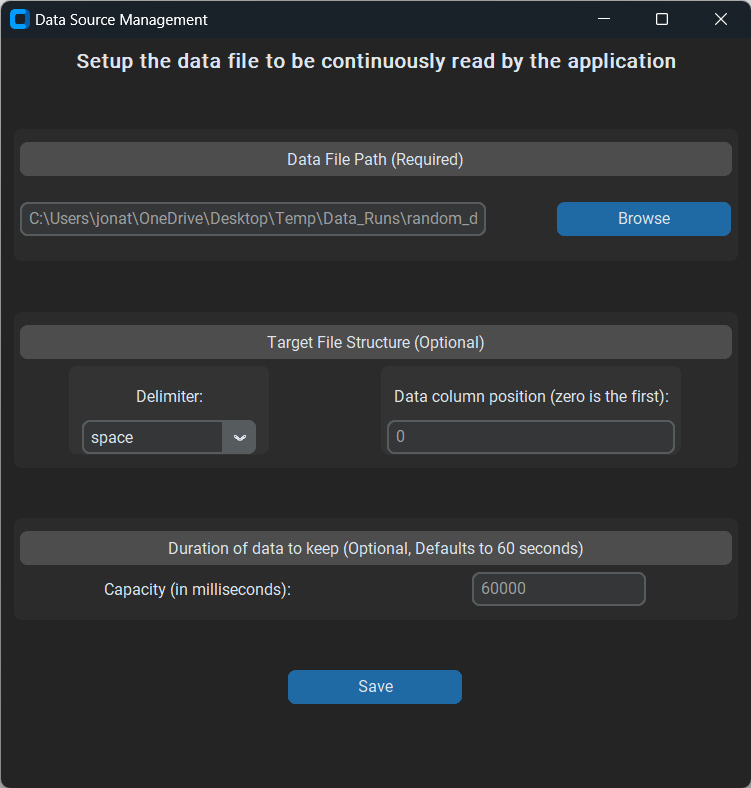
- File path - The path to the file that should be tailed as a data stream
- Delimiter - If the file is a delimited text file, this is the delimiter for the tool to use to parse columns
- Data Column Position - If the data values are not in the first column of the target file then this allows users to specify which column to read (default is zero aka the first columns)
- Capacity (in milliseconds) - The amount of raw data the chart should cache. Statisitcs and data condition triggers can only be calculated on cached data.
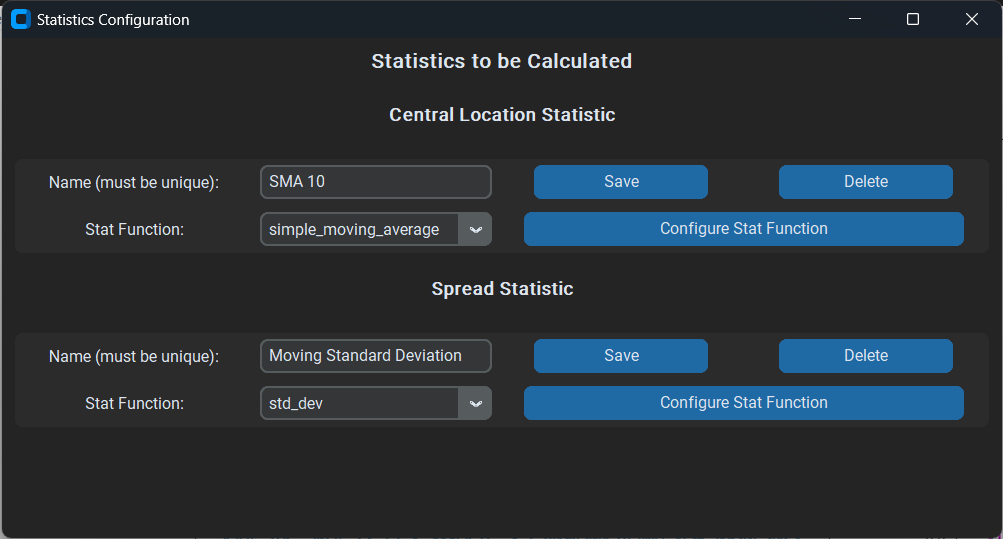
Users can specify precanned statistics to be calculated and plotted on the right graph. Both a measure of central location (mean, moving average, exponentially weighted moving average) and a measure of spread (standard deviation, variance) can be plotted.
To setup statistics, a user clicks on the "Data and Statistics" menu and selects the "Statistics Setup" menu option. This will open the Statistics Configuration menu and allow either or both of a central location and a spread statistic to be established.
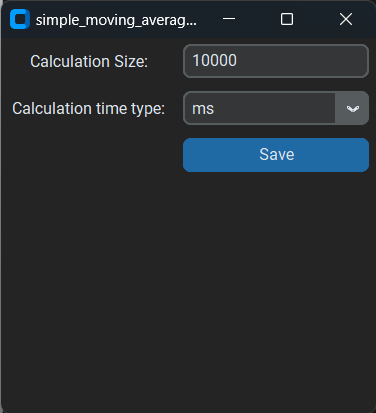
Each statistic function can be configured via a window to control the size of the data set used for the calculation. The size and size type (milliseconds or number of data points) are used to slice the cached data. If milliseconds is chosen, all data points within the past Calculation Size number of milliseconds are used in the calculation. Statistics may have specific parameters to be set via the same window as applicable (e.g., an alpha value for an exponentially weighted moving average).
Triggers are conditions within either statistics or . The backend code currently supports arbitrary and/or/xor combinations of triggers; the front end UI has not caught up with this functionality to allow dynamic non-coding building of arbitrary logical conditions.
In this example multiple instances of data that met a high run trigger condition (consecutive data points absolute value were over a threshold) occured. The tool highlighted the points in red.
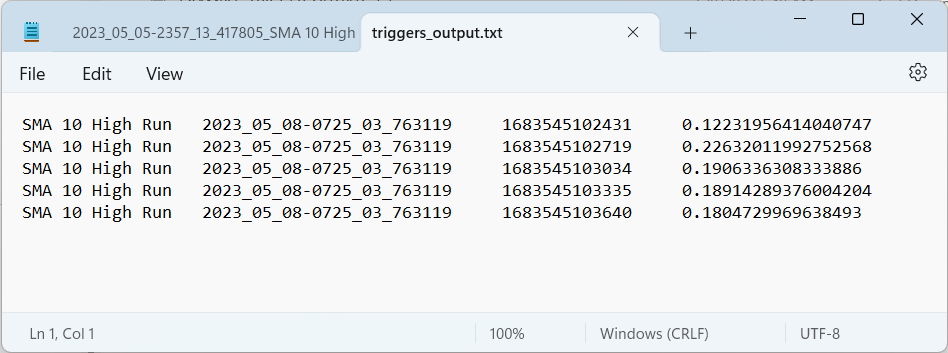
In this example multiple instances of data that met a high run trigger condition (consecutive data points absolute value were over a threshold) occured. The data points with timestamps are output (both a string timestamp and a number of milliseconds past UNIX epoch). Two ouputs are created via triggers, one that is a single file containing all trigger outputs and one that is individual files per trigger instance.

To setup triggers, a user clicks on the "Triggers" menu and selects the "Setup Triggers" menu option. This will open the Trigger Configuration menu and allow seeing/deleting current triggers or creation of new ones.
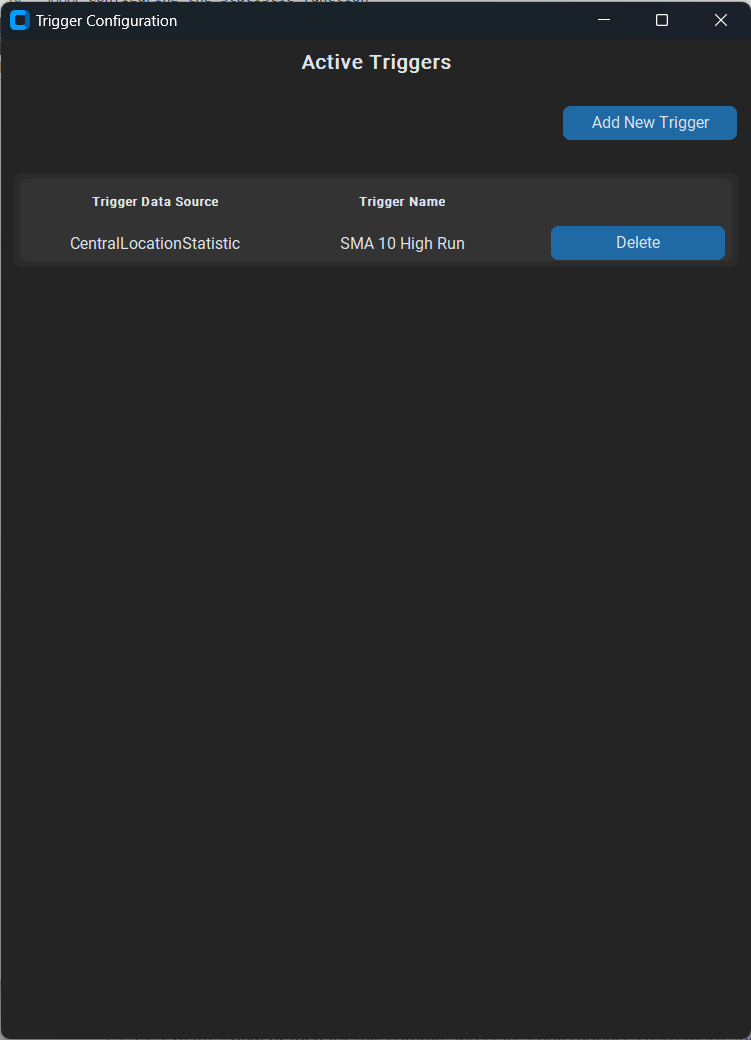
In this example screenshot a trigger against the central statistic has been made and was named SMA 10 High Run
If the add trigger button is clicked the Create New Trigger window is opened where the user must select the function behind the trigger and what data the trigger will run against. Depending on what trigger function is selected the fields required to be filled in will change (e.g., high run requires a threshold).

Via the "File" menu Save option users can export the current Data Stream, Statistic, and Trigger setup into a json file. This can then be loaded in subsequent usage of the tool via the Load menu option.
Via the Settings menu, general chart configuration option setting affecting the plotting of the charts can be adjusted.

- Chart and Data Refresh Frequency - This setting dictactes how often the data source file is read and statistics/triggers/plots are calcualted (default every 100ms or 10Hz)
- Y limits - There are y axis limit options for the data plot and each statistic plot (by default they are automatically adjusted based on the cached data being shown)
Via the "Run" menu the plots can be stopped and started using the "Reset and Stop Chart" and "Start Chart" options respectively. Some actions like changing the data source will automatically stop restart (clear chart data).