You signed in with another tab or window. Reload to refresh your session.You signed out in another tab or window. Reload to refresh your session.You switched accounts on another tab or window. Reload to refresh your session.Dismiss alert
I am encountering an issue with label placement with the stat_bin2d function when using a transformed axis such as log or sqrt. Essentially the labels are misplaced or missing in the latter case, as shown below
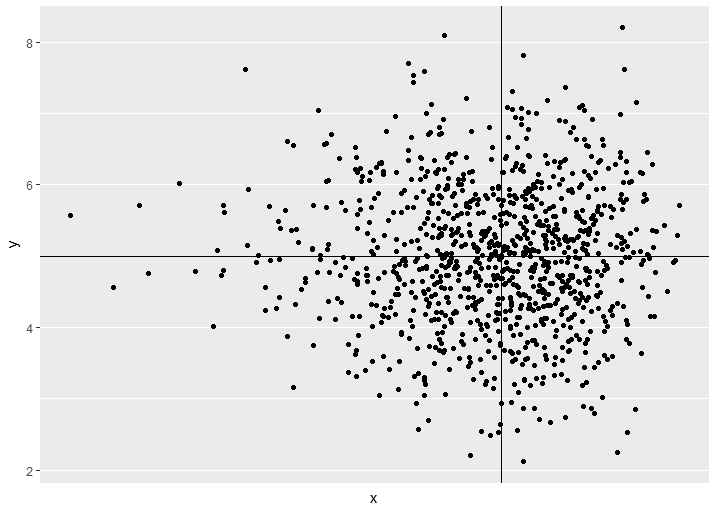
This gives a correct placement of labels showing the number of data points in each quadrant:
However the addition of scale_x_log10() causes all of the labels to be lost. Depending on the exact axes, sometimes only some labels are lost. The numbers may also change indicating that the bins are incorrect.
The text was updated successfully, but these errors were encountered:
has2k1
added a commit
to has2k1/ggplot2
that referenced
this issue
Dec 11, 2017
I am encountering an issue with label placement with the stat_bin2d function when using a transformed axis such as
logorsqrt. Essentially the labels are misplaced or missing in the latter case, as shown belowThis gives a correct placement of labels showing the number of data points in each quadrant:
However the addition of

scale_x_log10()causes all of the labels to be lost. Depending on the exact axes, sometimes only some labels are lost. The numbers may also change indicating that the bins are incorrect.The text was updated successfully, but these errors were encountered: