Celldetekt uses a sliding-window approach to quantify cellular gene expression within in situ hybridized tissue sections. The algorithm is described in J Microscopy 217:3, 275-281 (2005); when using Celldetekt, please cite this manuscript. Restrictions on use are described in the LICENSE.txt file.
- New graphical user interface (GUI)
- Scaling parameter introduced to allow adjustment for different image magnifications
- Interactive preview of results to quickly optimize parameters
Version 2.7 updates were introduced by Tipparat Umrod while working at the Texas Advanced Computing Center at the University of Texas at Austin.
The easiest way to use Celldetekt is to download the executable for MacOSX or Windows using the following links:
Then just double click the file to open up Celldetekt. If you do this, skip ahead to "Download and Run".
Another option available is to run Celldetekt from the command line.
- Python 2.7
- virtualenv
- pip
$ easy_install virtualenv
$ easy_install pip
(Note - for installations, you may need to use sudo. New versions of python may have pip already installed.)
$ git clone https://github.com/tumrod/cellDetekt.git
you may need to specify the python path with: -p < python path >
$ virtualenv -p /usr/bin/python2.7 cdenv
$ virtualenv cdenv
$ source cdenv/bin/activate
(cdenv) $ pip install -r requirements.txt
(cdenv) $ python celldetekt.py
- You may need to use sudo at start of other commands if there are permission issues.
- You can deactivate the virtualenv by
(cdenv) $ deactivate
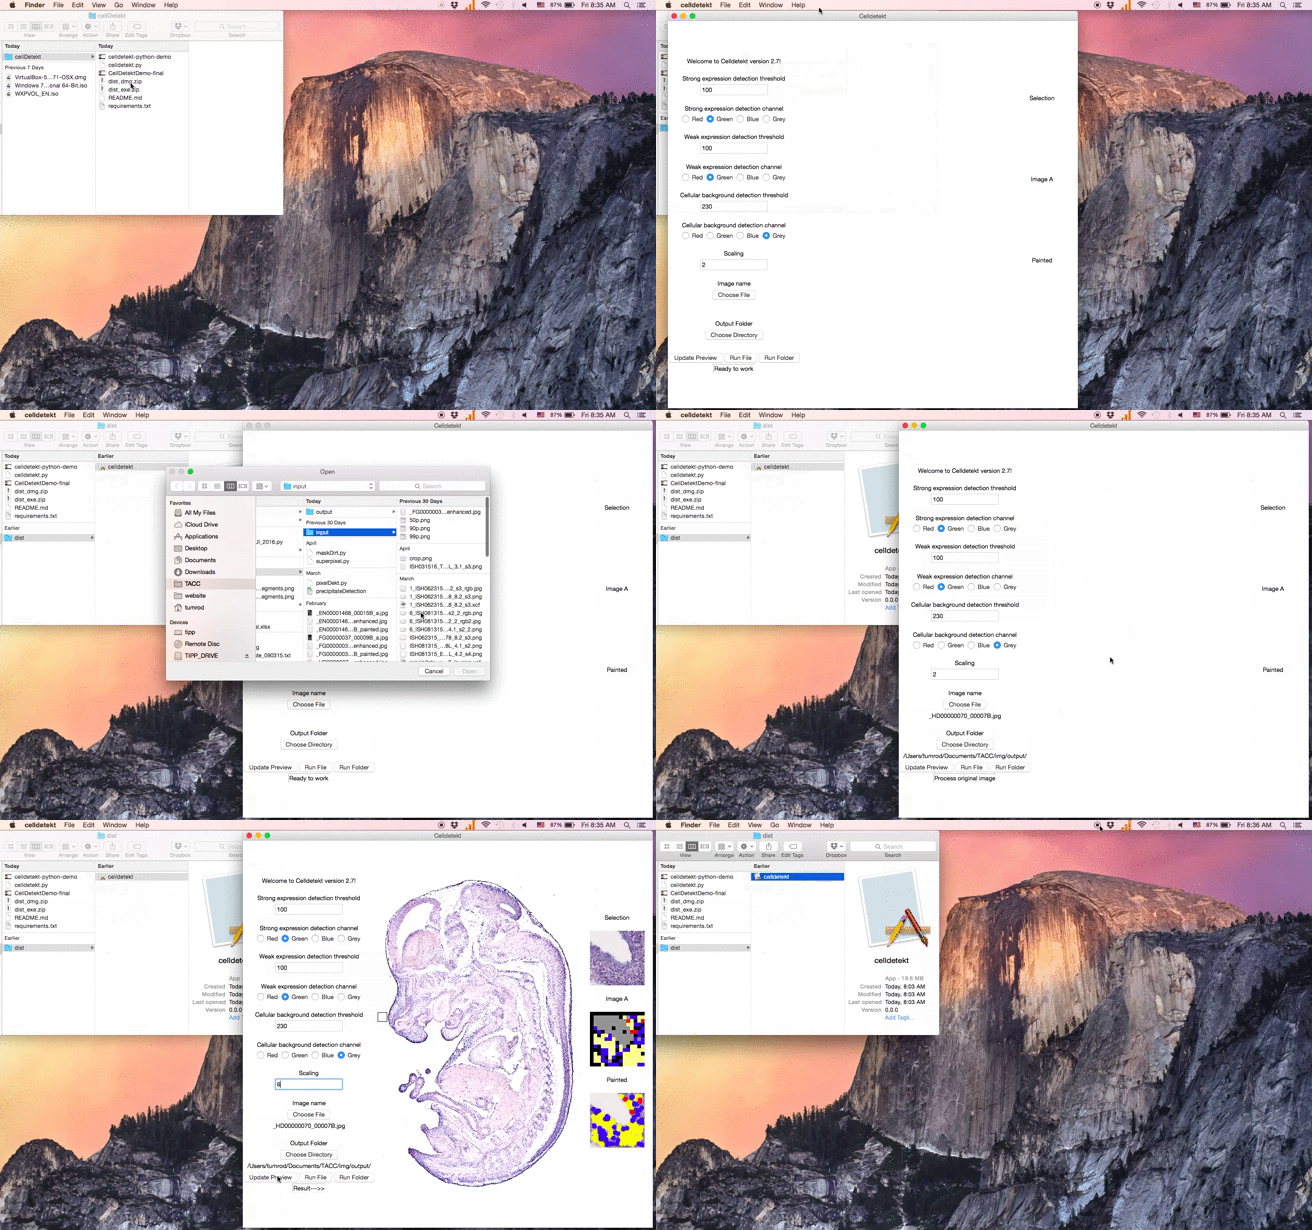
Celldetekt can be applied to a single image or a folder of images from the same ISH experiment. The basic process is to:
- Select a representative input image.
- Select an output folder.
- Click "Update preview".
- Click a location on the image to set a preview region and see Celldetekt results for that region.
- Change parameters and then go to step 3 or 4.
- Once happy with parameters, click "Run File" to apply to entire image or "Run Folder" to apply to all images in the same folder as the input image.
Here is an animation demonstrating the use of Celldetekt with MacOSX.
- Selection: Preview selected section
- Image A: "A" channel encoded into RGBA output image. With proper scaling, 1 pixel roughly represents 1 cell
- Painted: Expression painted onto to resized original image
- Red: Strong expression in the cel
- Blue: Medium expression in the cell
- Yellow: Weak expression in the cell
- Gray: Cell without expression
- Black: Background/ no cell
Threshold between 0-255: Red/Blue color represented on the preview
- Detect cells strongly or moderately expressing probed target
- Adjusting the scale to be on a lower threshold will detect the cellular expression at lower level.
Channels: Red, Green, Blue, Grey
- Depends on the color stain, choosing the contrasting channel
- For example, purple stain (blue+red), the contrasting channel would be green
Threshold between 0-255: Yellow color represented on the preview
- Detect cells weakly expressing probed target
Channels: Red, Green, Blue, Grey
- Depends on the staining colors, choosing the contrasting channel
- For example, purple stain (blue+red), the contrasting channel would be green
Threshold between 0-255: Grey color represented on the preview
- Detect cells not expressing probed target
Channels: Red, Green, Blue, Grey
- Default to grey, unless the tissue has background staining
- Scaling the cell size: smaller number = smaller cell size
Update Preview:
- Update the image preview on the right panels with currently selected parameters
Run File:
- Run the current parameters on current image to create Image A and Painted image for the entire image
- Outputs in the selected output directory
Run Folder:
- Run the current parameters on all the images in the selected input directory
- Outputs in the selected output directory


