TEMPERATURE FORECAST • Objective: Perform an exploratory data analysis and build a prediction model for temperature forcast based on the CRISP-DM process for the dataset below. The thought process and conclusions will be shares throughout this notebook. • Dataset: Bias correction of numerical prediction model temperature forecast Data Set from UCI
Table of content • Import libraries • Read dataset • Exploratory data analysis ▪ General information ▪ Missing values ▪ Categorical variables ▪ Numerical variables • Machine learning model • Conclusion
- Import libraries
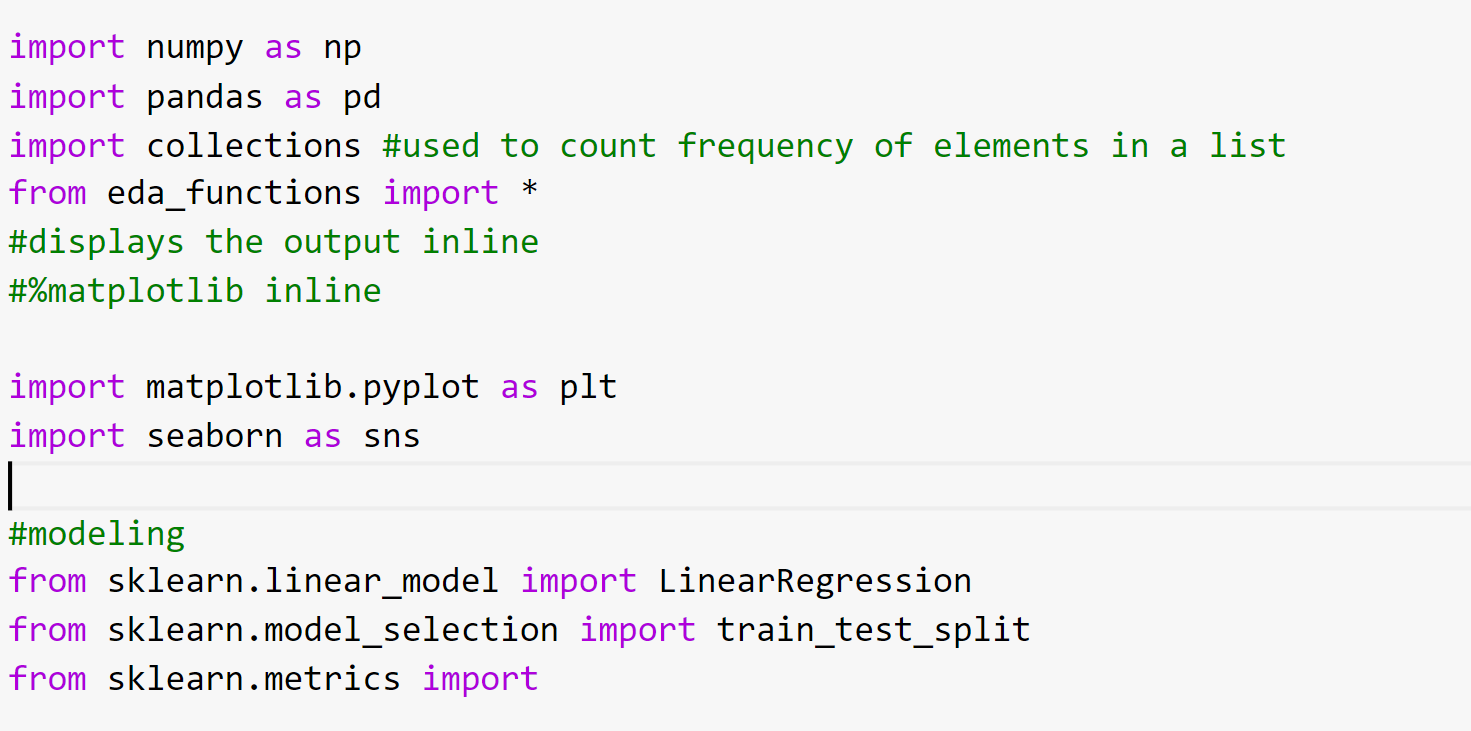 Libraries used numpy,pandas,matplotlib,seaborn,sklearn etc.
-
READING DATASET
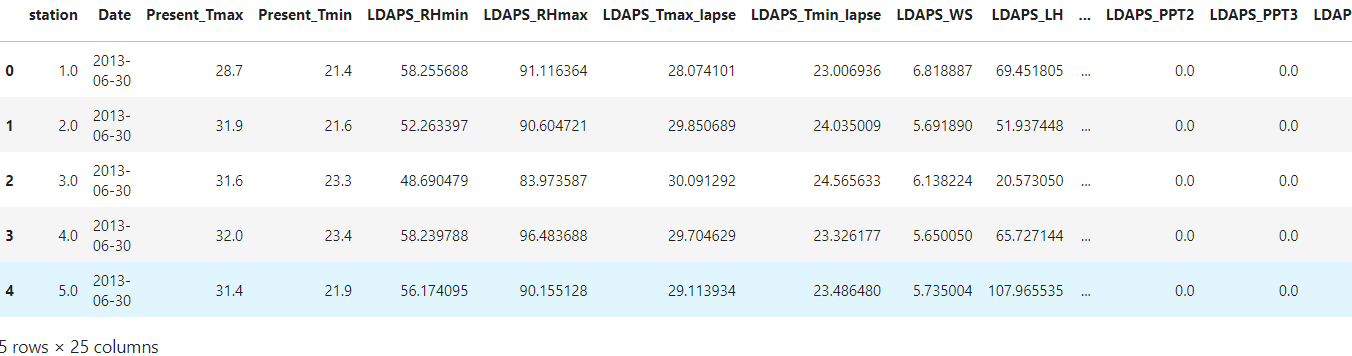
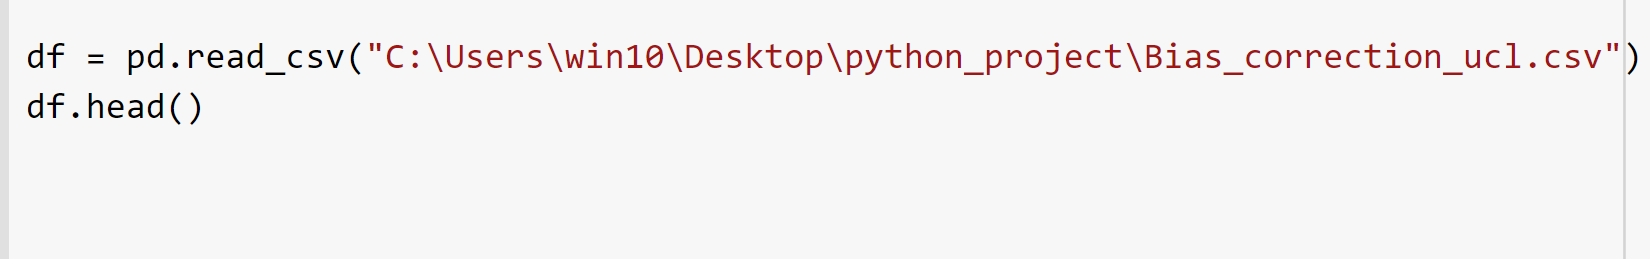 ▪ OUTPUT
-
Exploratory Data Analysis ▪ General information
No. of dataframes are 7752 rows and 25 columns
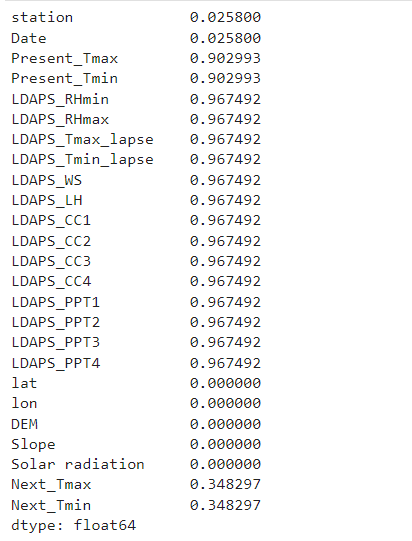
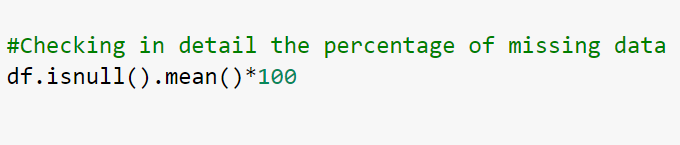
▪ Missing values
There are 20 from 25 columns with missing values: Columns with no missing values = {'LDAPS_Tmax_lapse', 'L DAPS_PPT2', 'Date', 'station', 'LDAPS_PPT1', 'Present_Tmin', 'LDAPS_RHmax', 'Next_Tmax', 'LDAPS_CC1', 'LDAPS_Tmi n_lapse', 'LDAPS_PPT3', 'LDAPS_LH', 'LDAPS_CC4', 'LDAP S_RHmin', 'LDAPS_CC3', 'Next_Tmin', 'LDAPS_WS', 'Presen t_Tmax', 'LDAPS_CC2', 'LDAPS_PPT4'}
There are 0 from 25 columns with more than 75.0% of missing values: Columns more than 75.0% of values missing = set()
There are 0 from 25 columns with more than 50.0% of missing values: Columns more than 50.0% of values missing = set()
 ▪ OUTPUT
 The dataframe has 7588 rows and 25 columns
▪ OUTPUT
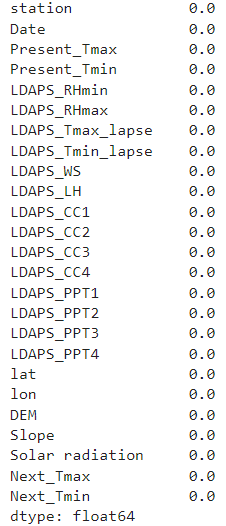
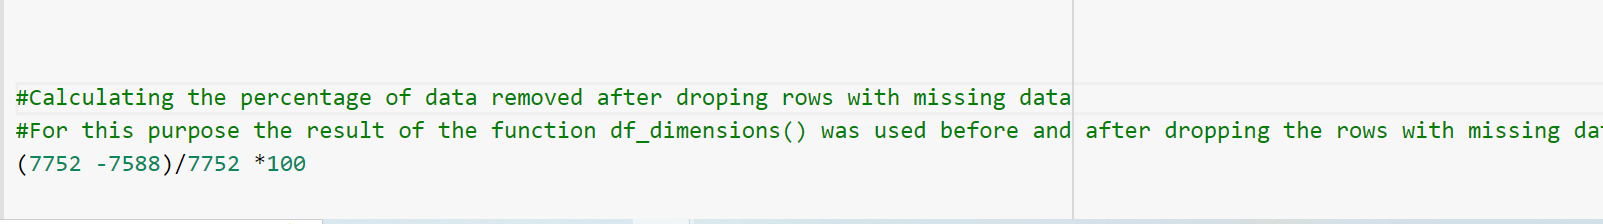
OUTPUT: 2.1155830753353975 • The rows with missing values were droped successfully and 2% of the data was lost.
• Categorical variables:

There are 1 from 25 columns with categorical data Columns categorical data = ['Date']

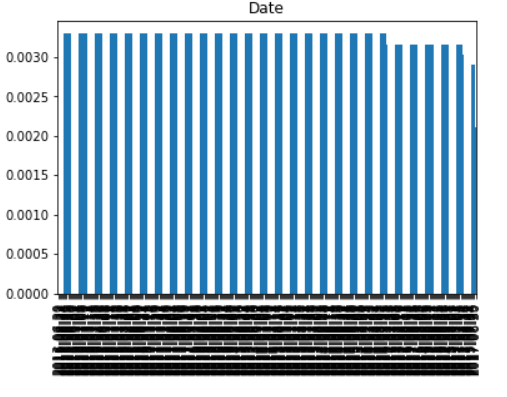
 • OUTPUT: 307

• OUTPUT: ‘2013-06-30’

• OUTPUT: ‘2013’

• OUTPUT: ‘06’