Repository navigation

Replies: 3 comments 1 reply

|
Here's the Gantt view of the tasks, percentage complete: 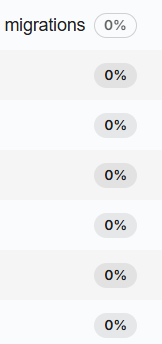
Then the view in the web portal, percentage complete: 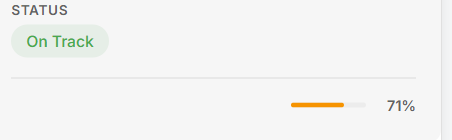
|
|
Somewhat related... I see that items I create on the Tasks tab get shown in the Gantt chart, yet they have no Completion percentage slider. It appears that once you move them into In Progress, a task jumps to a percentage complete based on start + end, but with no way to modify that. Conversely, tasks entered in the Gantt Chart tab do NOT show up in the Task list. Should they? It feels like the two concepts could stand alone, but they have some crossover point, and I'm just not sure how to manage where a task should go (in the Tasks or a Task in the Gantt Chart?) or where it is updated. Tasks in the Task tab also don't seem to influence the overall completion percentage for the project... |

|
Hi Bruce Thanks for the detailed report, and I looked into all three points
If you want real progress on the card and in the portal, 2.142.0 adds a way: in Admin → Metamodel add a Percentage field to Initiative, in Admin → Calculations give it the formula ppm.completion, and tick that field in the portal settings. It updates whenever a task, work package, risk or status report changes. |
|
Good stuff! I was thinking that percentage was data quality (just "happened" to match), but was thrown off by the label. I'll look into #3 - great idea, and thanks for the new field type! |


Uh oh!
There was an error while loading. Please reload this page.
I probably should have noticed this before, but I use the web portal as an appeasement for some executive types who want to see only the big picture, so I wasn't honestly paying as much attention to them as I should have been. Today that changed.
I noticed that all of the initiatives (projects) which I have entered into Inventory, with a start date and end date, and some with a few tasks and work packages, are showing a certain percentage complete when no tasks have been completed. For example, I have one small project starting 30-Sep-2026, end 31-Jan-2027. It has 5 tasks and a milestone. All tasks are at 0% complete. Yet in the Initiative view web portal, that project shows 71% complete. Clearly, that can't be. So how is it calculating percentage complete?
Thanks,
Bruce
All reactions