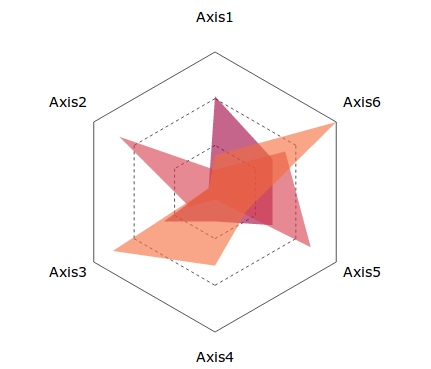
A light weight tool to create radar chart with AngularJS
the orignal d3-radar chart is from https://github.com/alangrafu/radar-chart-d3
+Angular Support
+More options
+Improve positioning,radar chart auto adjust and always in the middle of its parent div
1. Create basic Angular.js application
Create a html page and start with the following code.
<!DOCTYPE html>
<meta charset="utf-8">
<html>
<head>
Include the downloaded dependencies in the <head> section of the html.
<script src="angular-radar/src/angular-radar.js"></script>for example
angular.module('RadarApp', [
  'angular-radar'
])<radar-chart val="data"></radar-chart>Here are the options that can be config
            scope: {
                maxValue:'=',
                val: '=',
                width:'=',
                height:'=',
                levels: '=',
                rotate: '=',
                chartScale: '=',
                legendScale: '=',
                colorFunction: '=',
                radians:'=',
                opacityArea:'=',
                fontSize:'=',
                tips:'@'
            }
Data format
[
  [
   {axis: "Axis1", value: 13},
   {axis: "Axis2", value: 1},
   {axis: "Axis3", value: 8},
   {axis: "Axis4", value: 4},
   {axis: "Axis5", value: 9},
   {axis: "Axis6", value: 9}
  ]
  ,[
   {axis: "Axis1", value: 3},
   {axis: "Axis2", value: 15},
   {axis: "Axis3", value: 4},
   {axis: "Axis4", value: 1},
   {axis: "Axis5", value: 15},
   {axis: "Axis6", value: 11}
  ],[
   {axis: "Axis1", value: 5},
   {axis: "Axis2", value: 1},
   {axis: "Axis3", value: 16},
   {axis: "Axis4", value: 10},
   {axis: "Axis5", value: 5},
   {axis: "Axis6", value: 19}
  ]
];
More detail can be found in example file
