| Build Status |  |
| Coverage | |
| Latest dev release |   |
| Latest release |      |
| Docs |   |
| Support |  |
Panel provides tools for easily composing widgets, plots, tables, and other viewable objects and controls into control panels, apps, and dashboards. Panel works with visualizations from Bokeh, Matplotlib, HoloViews, and other Python plotting libraries, making them instantly viewable either individually or when combined with interactive widgets that control them. Panel works equally well in Jupyter Notebooks, for creating quick data-exploration tools, or as standalone deployed apps and dashboards, and allows you to easily switch between those contexts as needed.
Panel makes it simple to make:
- Plots with user-defined controls
- Property sheets for editing parameters of objects in a workflow
- Control panels for simulations or experiments
- Custom data-exploration tools
- Dashboards reporting key performance indicators (KPIs) and trends
- Data-rich Python-backed web servers
- and anything in between
Panel objects are reactive, immediately updating to reflect changes to their state, which makes it simple to compose viewable objects and link them into simple, one-off apps to do a specific exploratory task. The same objects can then be reused in more complex combinations to build more ambitious apps, while always sharing the same code that works well on its own.
Attractors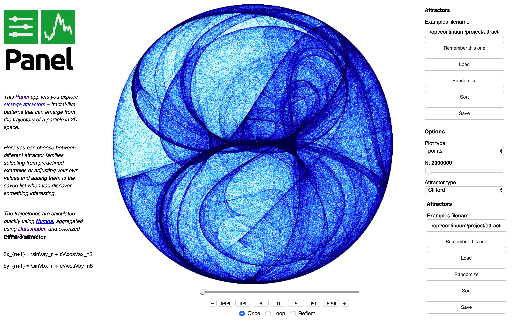 |
Gapminders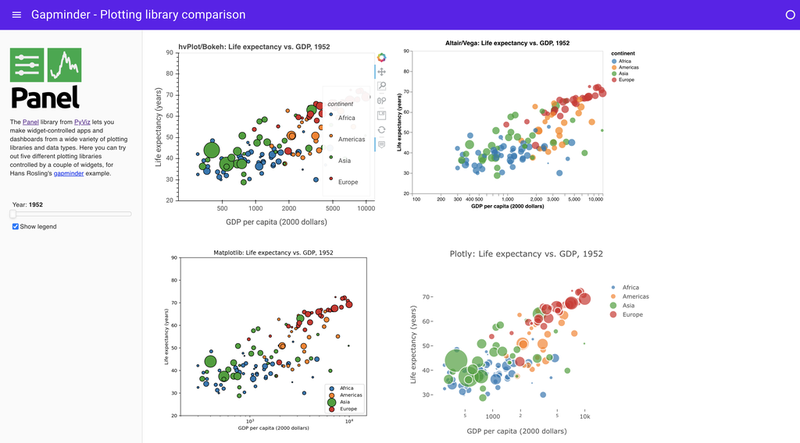 |
NYC Taxi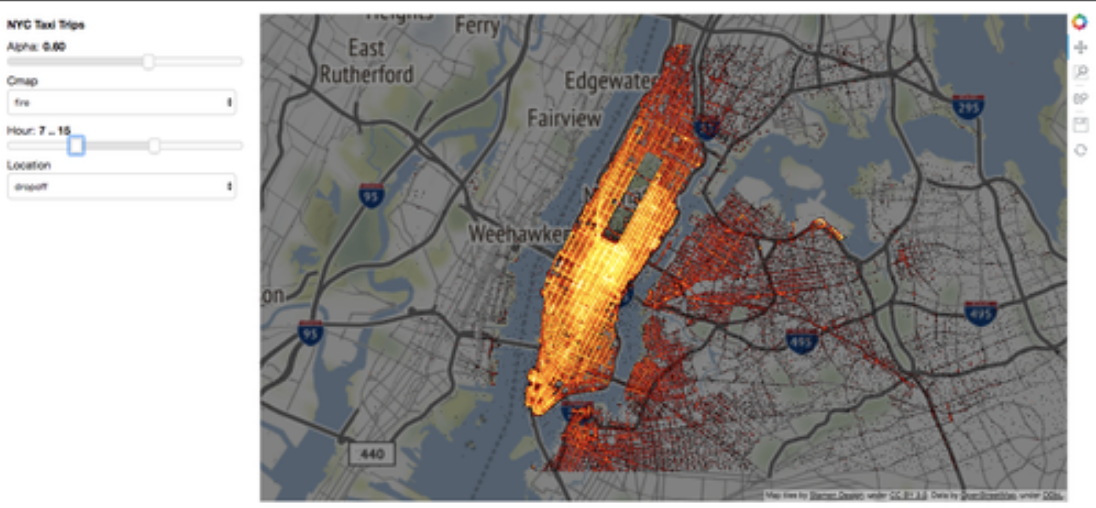 |
Glaciers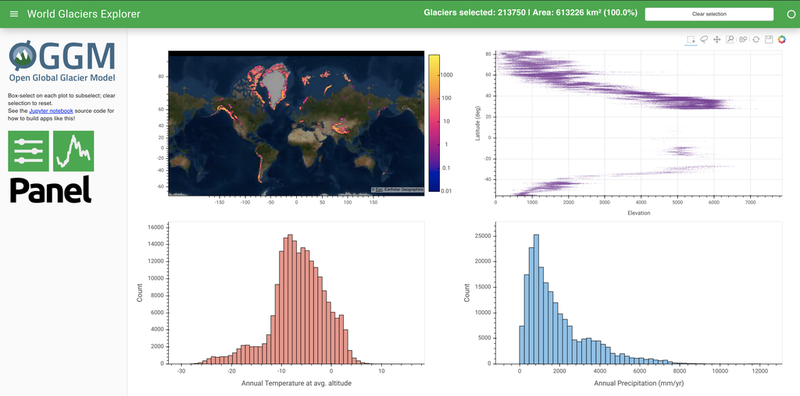 |
Portfolio Optimizer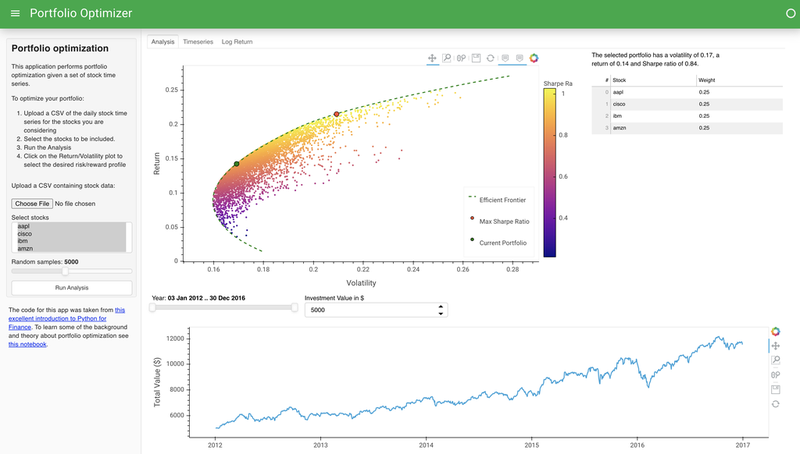 |
Panel can also be used with the separate Param project to create interactively configurable objects with or without associated visualizations, in a fully declarative way. With this approach, you declare your configurable object using the pure-Python, zero-dependency param library, annotating your code with parameter ranges, documentation, and dependencies between parameters and your code. Using this information, you can make all of your domain-specific code be optionally configurable in a GUI, with optional visual displays and debugging information if you like, all with just a few lines of declarations. With this approach, you don't ever have to commit to whether your code will be used in a notebook, in a GUI app, or completely behind the scenes in batch processing or reports -- the same code can support all of these cases equally well, once you declare the associated parameters and constraints. This approach lets you completely separate your domain-specific code from anything to do with web browsers, GUI toolkits, or other volatile technologies that would otherwise make your hard work become obsolete as they change over time.
Panel requires the pyviz labextension installed to be working in Jupyter Lab:
jupyter labextension install @pyviz/jupyterlab_pyviz