Use secondary axis for energy #126
Description
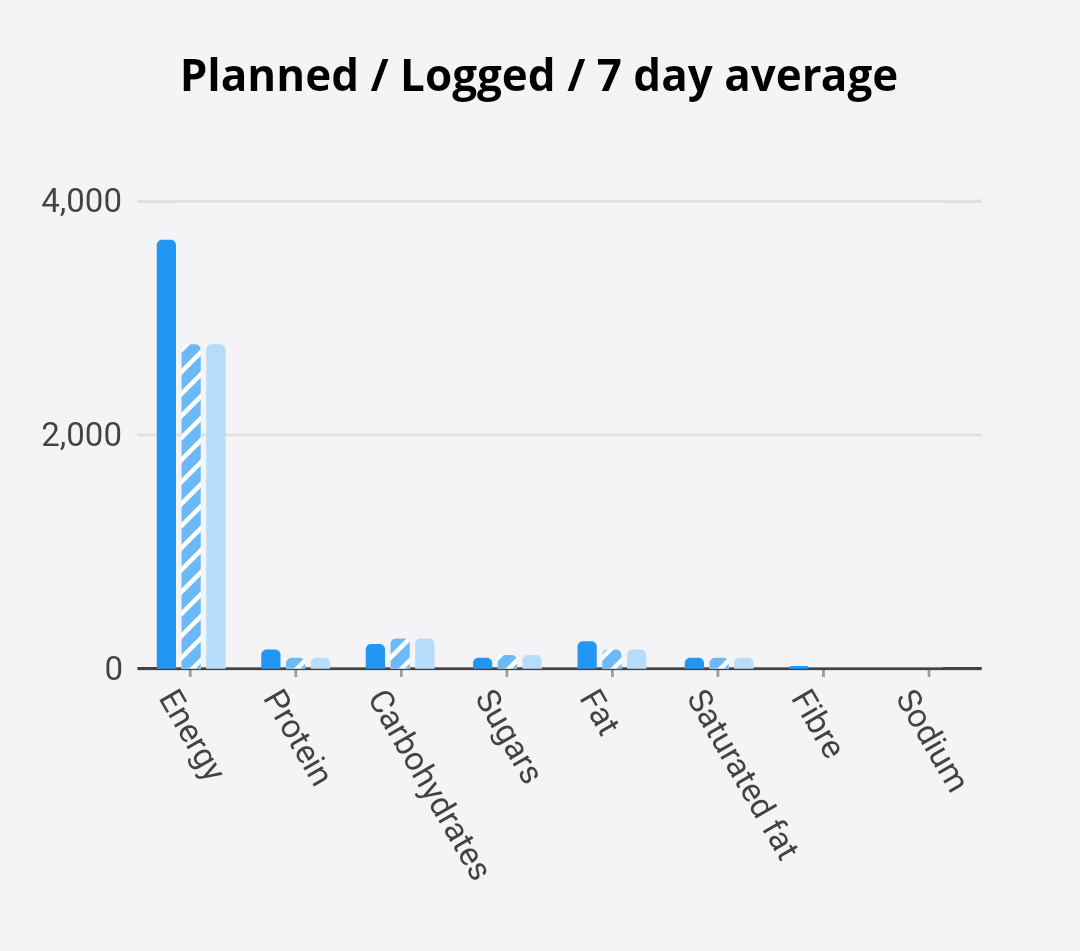
The graphs for logged / avg / 7 day average should chart energy (measured in kcal) and macronutrients (measured in g), since both use the same axis the energy would dominate the grap. At the moment the energy is commented out, but we would ideally use a secondary graph for the energy so that their values can still be compared