
Spring is here! It's the first day of April so we would like to gather weather data to observe metrics such as temperature, humidity, cloudiness, and wind speed for cities chosen at random based on their unique coordinates (latitude/longitude) on Earth.
- Install the CitiPy module to gather names of ~500 cities
- Get unique API key from OpenWeatherMap to access weather information
- In this folder, the api key has been hidden. Before running the script in Jupyter Notebook, you need to create a new file called config.py and create a string called api_key that contains your API key.
In the Jupyter Notebook file, citipy was used to gather names of cities at random. Weather data for these cities were retrieved through OpenWeatherMap and stored using Pandas. Matplotlib figures were generated to analyze data trends.
- Please see Jupyter Notebook file for reference.
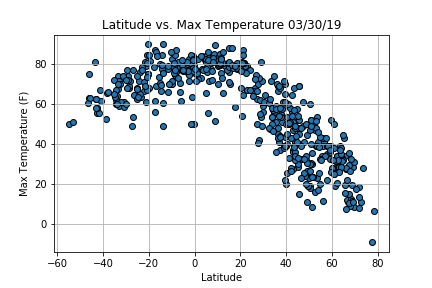
Weather is generally warmer in the southern hemispehere, and +/- 20 degrees from the equator. Interestingly, the weather in the northern hemisphere is significantly lower than the southern hemisphere during this time of year.

There is no strong relationship between latitude and humidity. It is interesting to observe that humidity ranges from 20-100% in both the northern and southern hemispheres at this time.

There is no strong relationship between latitude and cloudiness. However, there is a strong band of cities that resides at 0 and 90% cloudiness.

There is no strong relationship between latitude and wind speed. It is interesting to note that a good number of cities in both northern and southern hemispheres have low wind speeds, between 0-15 mph.
Ying Li