Repository navigation
v1.0.0 — the open Earth-observation globe

v1.0.0 — the open Earth-observation globe
RoamingEye is a browser-based 3D Earth for exploring decades of satellite
observations — and as of 1.0, for analyzing them. Everything below runs at
zkwizard.github.io/RoamingEye —
no account, no install, no backend, 100% open data.
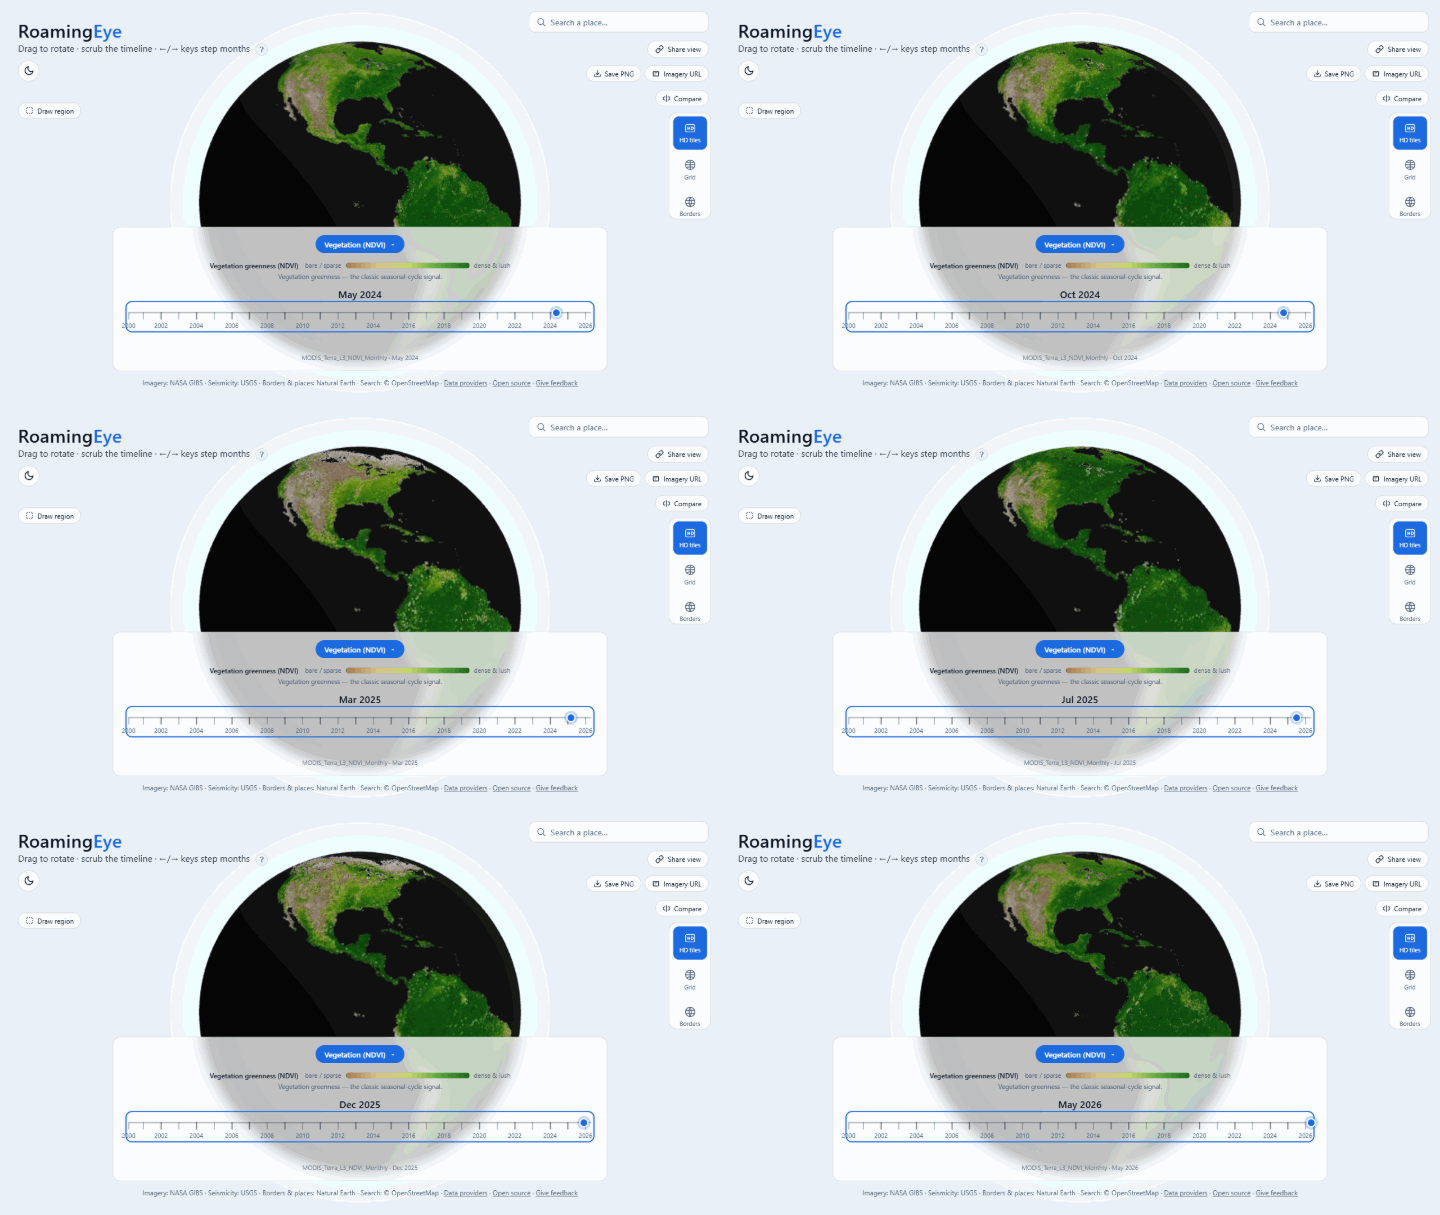
🚩 Draw a region, chart its history
The flagship. Arm Draw region, drag a box anywhere on the globe, and get a
chart of that region's monthly mean across the layer's full published record —
26 years for the MODIS layers, 46 for MERRA-2 — with Values/Anomaly views and
a CSV whose provenance headers record the exact bounds, method, and caveats.
Point probes work the same way: click anywhere, chart everything.
Values are reconstructed by inverting each layer's colormap on the streamed
imagery — approximate by design, labeled approximate everywhere — ideal
for trend-spotting and teaching before a real data pull.
🗺️ Eleven layers, one scrubber
Vegetation (NDVI/EVI), land & sea surface temperature, 2 m air temperature,
precipitation, soil moisture, snow cover, aerosols, terrain relief — and new
in this release, annual IGBP land cover (MODIS MCD12Q1, 2001→2024), the
catalog's first categorical layer, with all 17 classes named in the legend and
the scrubber stepping by year.
HD tile streaming (RFC-001) re-drapes the visible globe with WMTS tiles at
the level your zoom justifies — a screen-space-error quadtree with parent-tile
fallback and a GPU memory budget, all against NASA GIBS's public endpoint.
🌍 A globe that identifies what you see
Hover anything: coordinates and country everywhere, city names on the Cities
overlay, name · type · last-eruption on volcano markers. The geology trio
(plate boundaries, Holocene volcanoes, live USGS seismicity) carries in-app
color keys, and the 30 biggest cities label themselves at close zoom.
🔬 Built for reproducible observation
Every view is a citable URL — layer, month, camera, an open probe, even a
pinned comparison round-trip through the address bar. A/B compare any two
months with a draggable divider. Export PNG or the exact GIBS imagery URL.
CITATION.cff ships in the repo.
💪 Hardened for the field
1.0 closes three same-day robustness rounds (24 PRs, all tested — 222 unit
tests, 23 end-to-end):
- Friendly fallback when WebGL is blocked; in-place recovery from GPU context
loss; a Retry affordance when imagery fails. - Rendering pauses in hidden tabs; resolution adapts on weak GPUs; the app
payload is 33 kB gzipped (three.js cached separately) with size budgets
enforced on every build. - Your working context (layer, month, overlays) survives across visits.
- Focus-trapped modals,
prefers-reduced-motionsupport, keyboard navigation
end-to-end, and a phone-friendly bottom-bar layout.
🔭 The honest ceiling
Open data tops out around 30 m/pixel (Harmonized Landsat-Sentinel), which
powers the high-res study patches. Global multi-decade monthly composites are
1–2 km. That's the physics and the licensing of free data, stated plainly —
what's remarkable is how much science fits above that floor.
🙏 Data
NASA GIBS (imagery, public domain) · USGS (seismicity) · Smithsonian GVP
(volcanoes) · Natural Earth (borders, places) · Bird 2003 (plate boundaries) ·
OpenStreetMap Nominatim (search, ODbL). Full details in
DATA_SOURCES.md.
Contribute: good first issues
are seeded after every release · roadmap ·
give feedback
(three questions, two minutes).