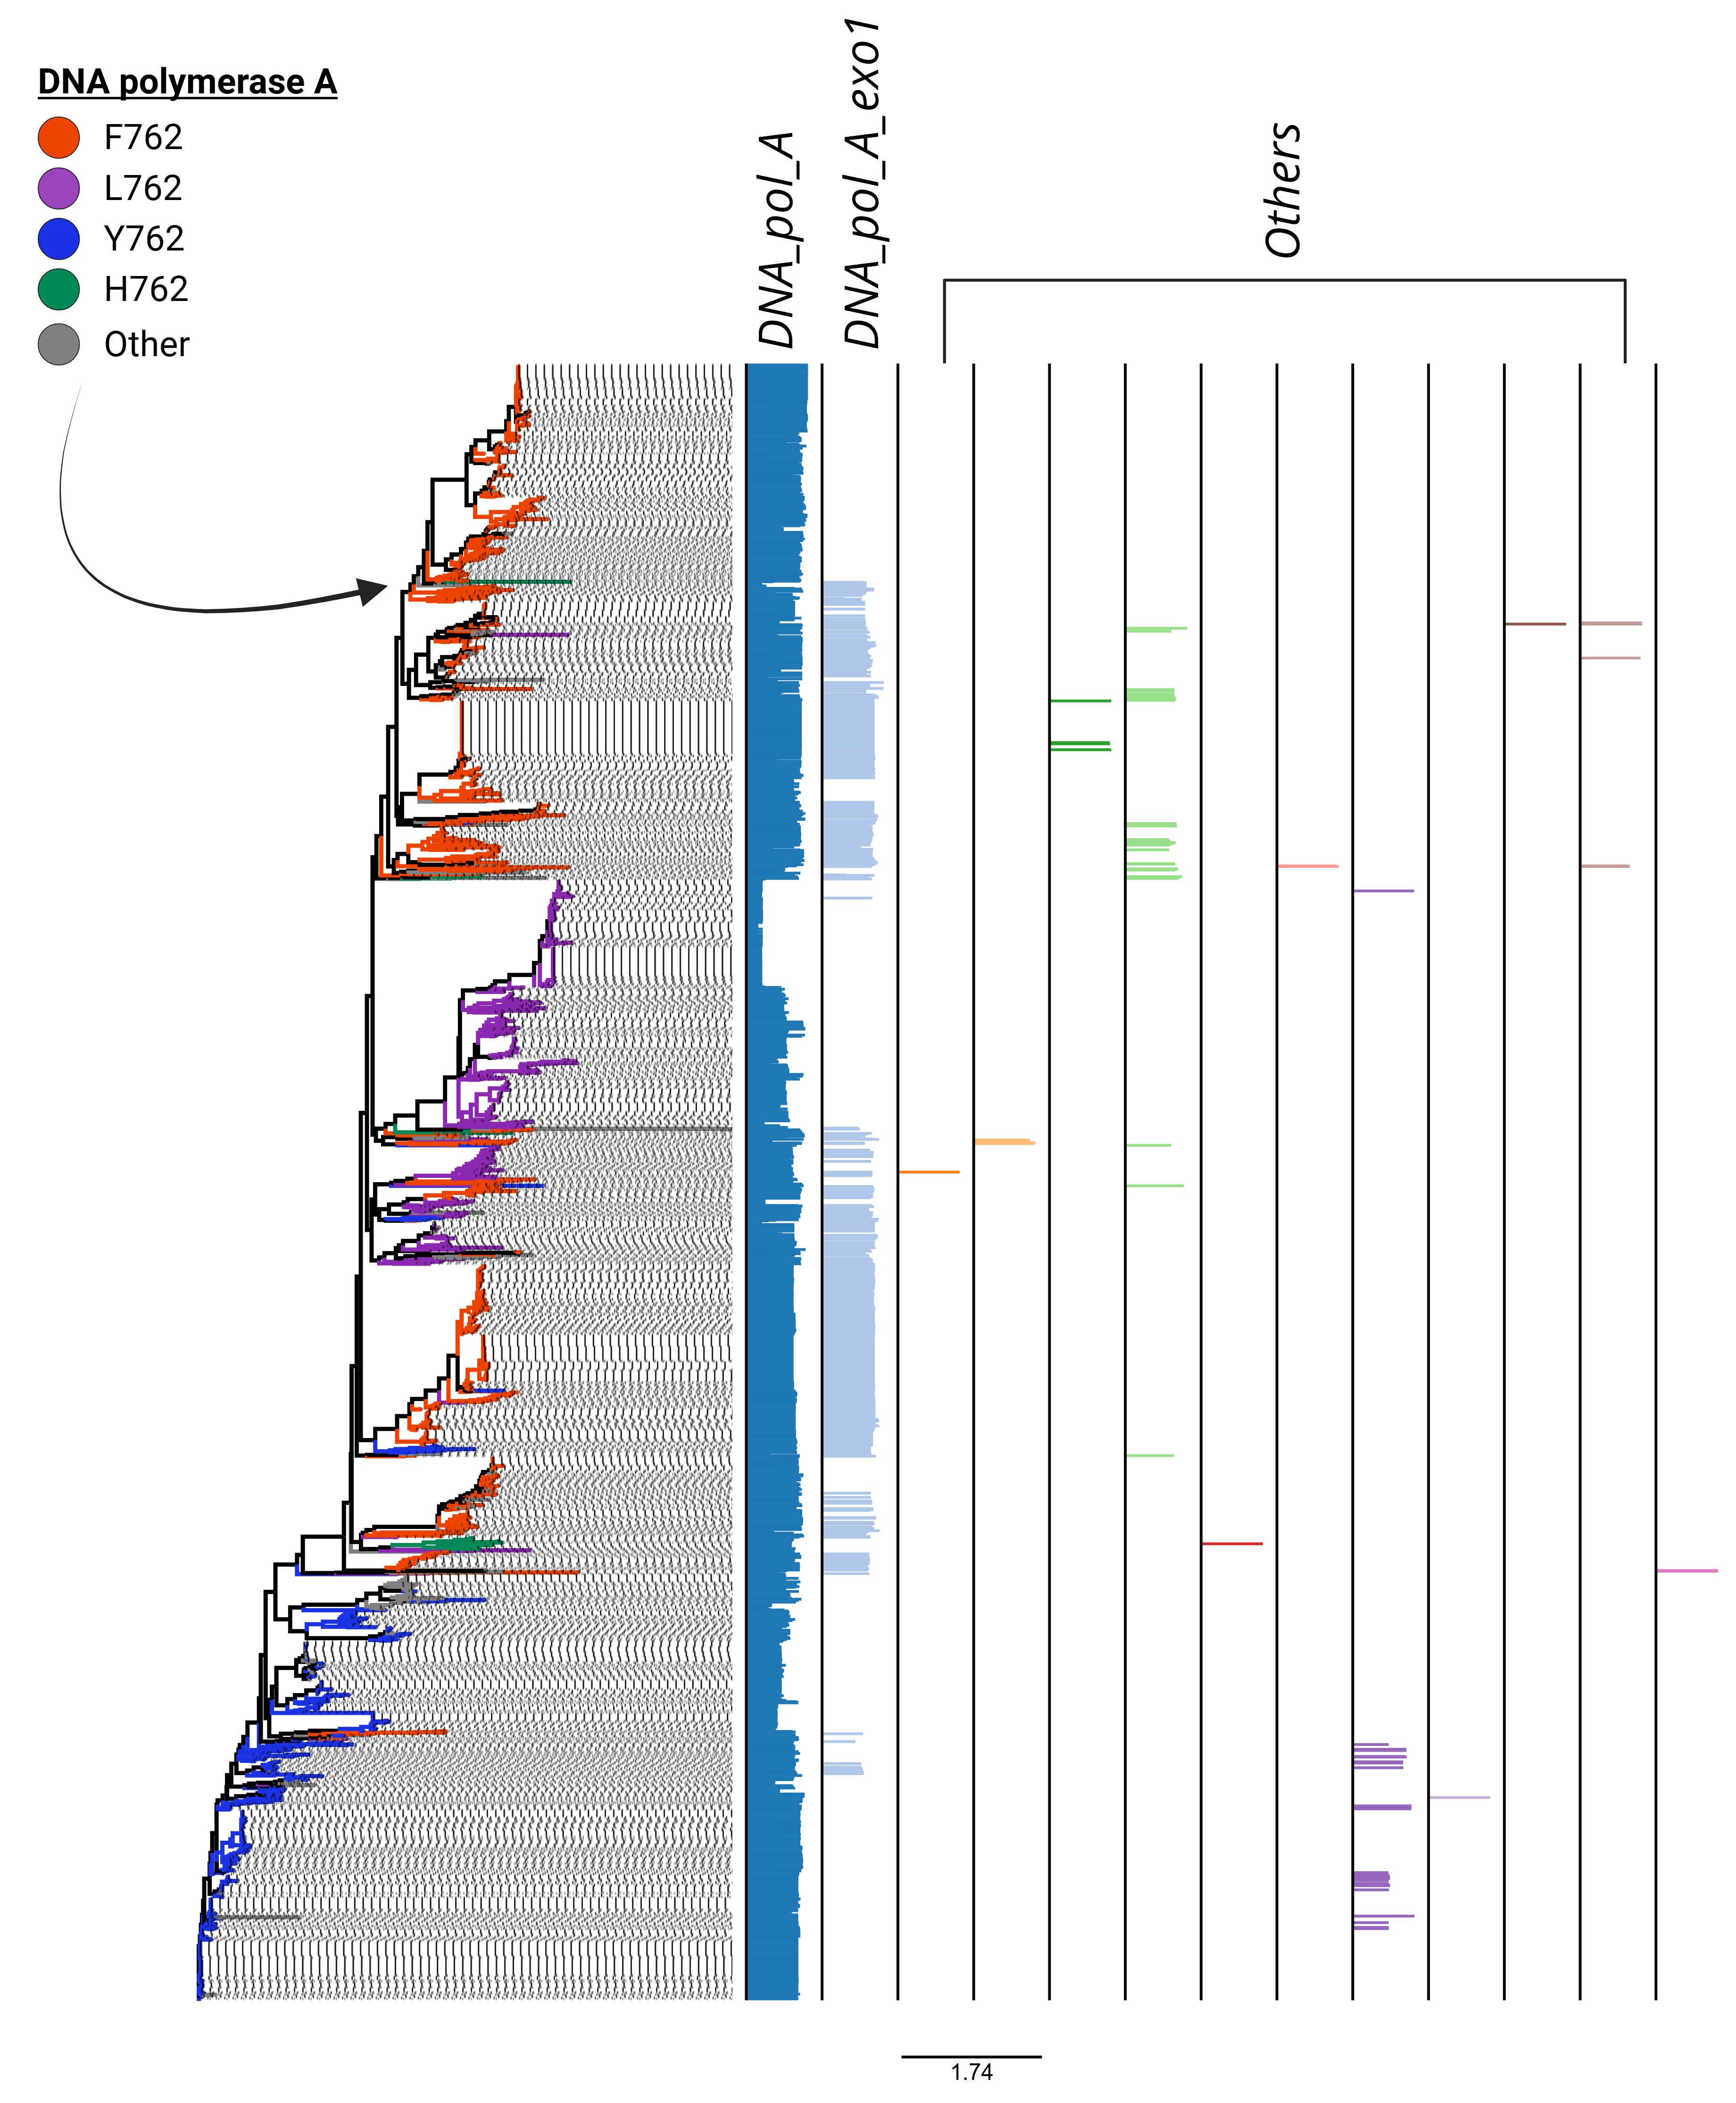
A simple script to transform PHIDRA pfam_validated_report.tsv domain annotations into a color-coded mapping file for tree visualization.
- Reads a TSV of Pfam hits per query
- Calculates bar heights = |Env_Starts - Env_Ends| for each Pfam
- Assigns each unique Pfam a hex color.
- Outputs a TSV with one row per query used as a mapping file upload in Iroki
- Python 3.6+
- pandas
- seaborn
- matplotlib
python phidra_domain_to_tree_map.py <input.tsv> <output.tsv>
Contributors names and contact info.
Tree visuals provided by Iroki