Zomato is an Indian multinational restaurant aggregator and food delivery company. It provides information about restaurants, average cost for two, cuisines served, ratings etc. The dataset used for analysis is picked up from kaggle.com. This analysis would be most suitable for foodies who are looking to explore cuisines from various cities of the world based on their budget. The dataset has the following components:
● Restaurant Id ● Restaurant Name ● Country Code ● City ● Address ● Locality ● Locality Verbose ● Longitude ● Latitude ● Cuisines ● Average Cost for two ● Currency ● Has Table booking ● Has Online delivery ● Is delivering ● Switch to order menu ● Price range ● Aggregate Rating ● Rating colour ● Rating text ● Votes
To apply the concepts from Network Theory, Machine Learning and Optimization, and draw insights that would assist a person answer the following questions
-
How to minimise the spending while visiting a set of predefined criteria of restaurants?
-
What is the shortest path in which I can visit all the restaurants?
-
If I plan to visit a particular restaurant, are there any other restaurants that I can visit on the way to minimise the travel time covering multiple restaurants?
-
If a new restaurant was introduced in a particular city, what would be the average cost for two?
-
If a new restaurant was introduced in a particular city, will the restaurant deliver food? Exploratory Data Analysis
-
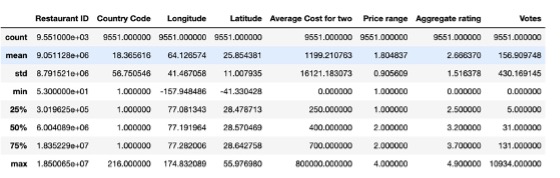
What is the mean, median, standard deviation of various attributes of data?
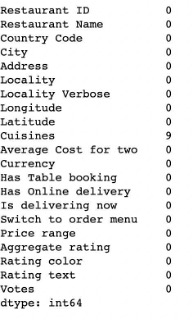
- Are there null values in the dataset? There are only 9 null values in cuisines. Apart from that there are no null values.
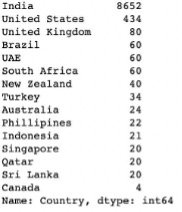
- How many restaurants are present for each country in the dataset? The dataset mostly contains restaurants from India.
Application of concepts to Dataset Scenario Let us imagine Adam - a foodie who recently started dating a girl and wants to take her out to restaurants in multiple cities. But he has no idea on where to start, how much it would cost etc. We will try to help him out through our analysis and provide insights so that he can impress her in the best way possible.
Adam is planning to take his girlfriend to Manchester but his girlfriend is pretty demanding and wants to go out on dates 20 times during their visit. But it doesn’t stop there as she has more specific demands:
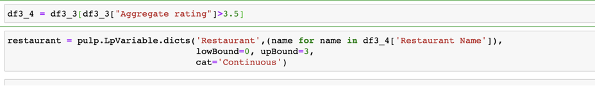
1.They should visit an European restaurant at least 8 times. 2.They should visit a Fast Food restaurant at least 5 times. 3.They should visit an Asian restaurant at least 4 times. 4.They should have some other cuisine at least 2 times. 5.They cannot visit the same restaurant more than 3 times. 6. They cannot visit a restaurant with less than a 3.5 zomato rating.
Adam, who recently started working, does not have a lot of money and wants to spend as little as possible while satisfying all his girlfriend’s demands. How can Adam achieve this?
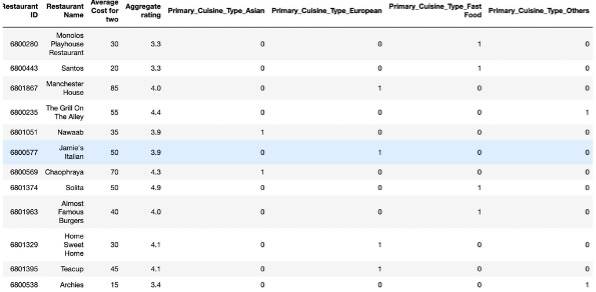
Let us look at the data snapshot
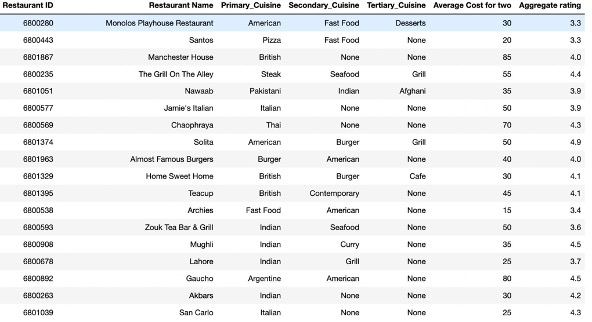
We preprocessed the data to split the cuisines into multiple columns and then created dummy columns to indicate the type of cuisine served by them.
Using the pulp package in python the problem is formulated

The solution for this problem is
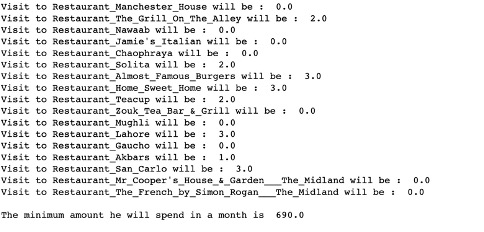
Adam would need to visit ‘The Grill on Alley’ 2 times, ‘Solita’ 2 times, ‘Almost Famous Burgers’ 3 times, ‘Home Sweet Home’ 3 times, ‘Teacup’ 2 times, ‘Lahore’ 3 times, ‘Akbars’ 1 time and ‘San Carlo’ 3 times to minimise the cost.
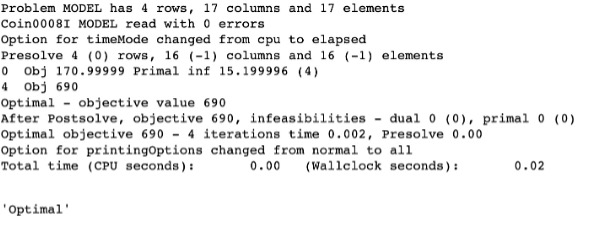
The minimum amount that Adam would end up spending is 690 pounds.
Output from Linear optimizer:
Scenario 1 : Adam with his girlfriend plans to visit Mumbai for a week-long trip. He decides to take her out to one restaurant each day. Adam wants to know if there are any other restaurants closer than the restaurant of interest in the same path he would take so that he can pay a visit to the closer restaurant than the one intended and reduce the expenditure on Uber.
To answer Adam’s question, we use the following subset data.
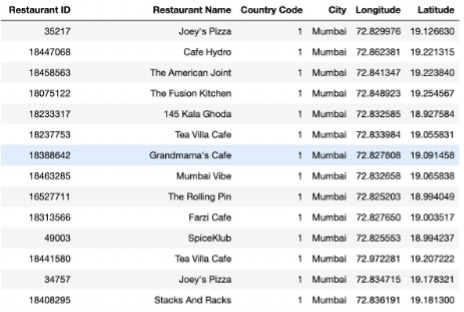
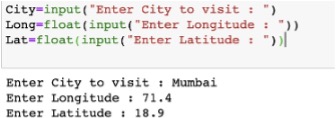
To detect the current location of Adam, we have to input the city, longitude and latitude. Using the Longitude and Latitude the distance from one restaurant to every other restaurant is computed. Using distance as weight, a network is created.
Code to input the current location
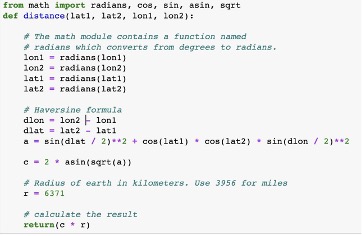
Function to compute distance
Using the single source dijkstra algorithm we can find the shortest distance from Adam’s current location to the restaurant of interest. If there are any other restaurants in the same path, and are closer, the algorithm will return the values.
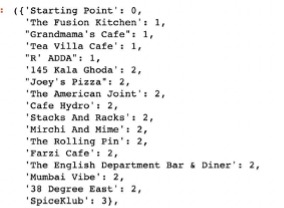
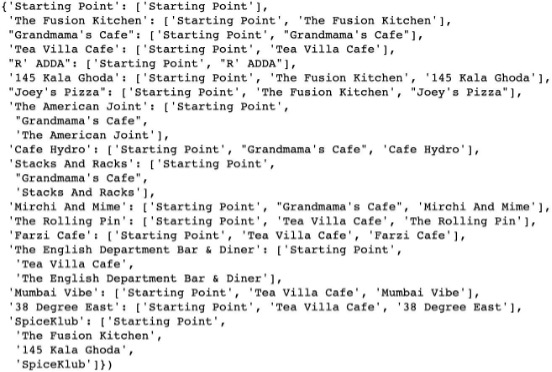
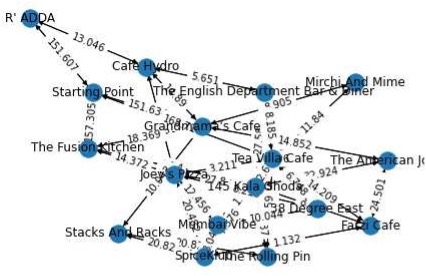
Scenario 2 : Adam and his girlfriend both have a sweet tooth. They decided to visit all restaurants in Mumbai which serves ‘Desserts’, using the Zomato database as a reference on a given day.They want to stop at their Hotel once to take a nap in between. How can they minimise their uber expenses

Where ‘G’ is the above graph. The optimal path from the analysis is:
'The Rolling Pin' ➡'Mumbai Vibe' ➡'Tea Villa Cafe' ➡’Hotel’ ➡ ’R' ADDA’ ➡'145 Kala Ghoda'
Objective : To predict the “average cost for two” given the location, ratings, votes, table bookings, delivery options etc. Prediction is made on the subset data filtering for India as the country.
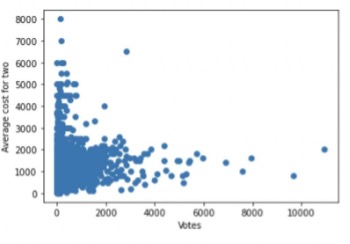
Relationship check with the target variable
- Scatter plot for votes vs average cost for two
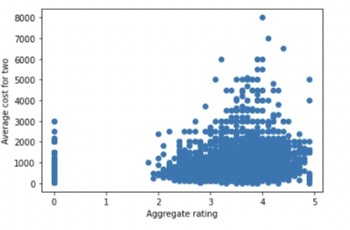
- Scatter plot for ratings vs average cost for two
Since categorical variables are present, dummy columns were created to encode the values

The dataset is split into 70% train and 30% test.

The Xgboost package is used to make predictions. Since this algorithm can run in parallel, we use thread = 4. Grid search methodology is used to find the best combination of hyperparameters for the model.
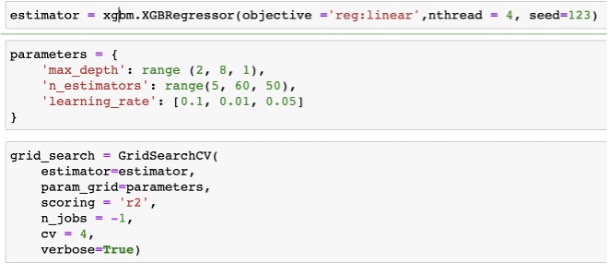
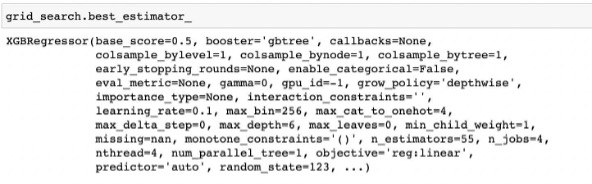
The best estimated parameters for the model are selected as shown below. Some of the important selected parameters are Max_depth = 256, n_estimators = 55, learning_rate=0.1
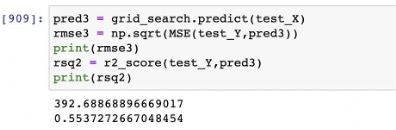
Xgboost model was fit using the best params from the grid search. The model achieved an r-sq of 55.37% on the test dataset.
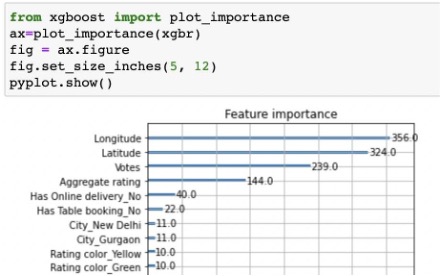
From the graph, we can see that the longitude and latitude, Votes and aggregate rating are the most important features in the model.
Objective: To predict if a restaurant present in a certain location has a home delivery service or not.
If Adam finds a new restaurant other than the ones in the list of restaurants present in the dataset, and is unsure if the restaurant has delivery service or not, the prediction made here will come in handy for Adam to plan a visit or order food accordingly.
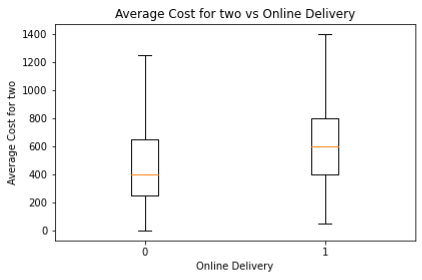
We can see that the Average Cost for two is an important differentiator for understanding whether a restaurant will deliver or not
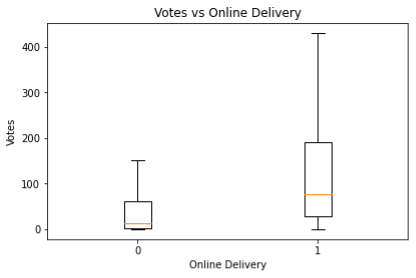
From the above graph we can see that Votes is an important differentiator for understanding whether a restaurant will deliver or not
Steps Undertaken:
- Data Treatment: We use a subset of data i.e., by filter for India as a country to make predictions.
- Data Split: Split the dataset to 90% train and 10% test

- Used one hot encoding to treat the categorical variables
- Used grid search the find the optimal parameters for the model using AUC-ROC as the primary metric
- Constructed the decision tree using the optimal parameters. The optimal parameters are (max_depth - 6, n_estimators=30, learning_rate=0.3)
Confusion Matrix
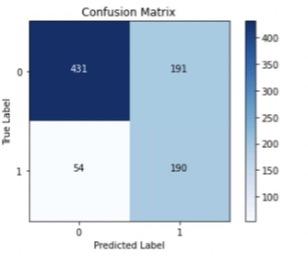
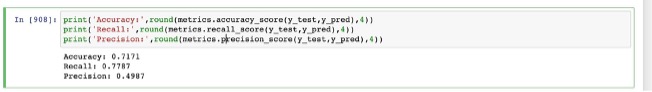
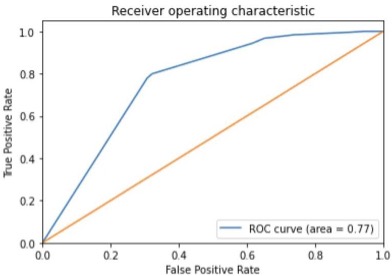
The Recall for the model is 0.7787, so our model is able to identify ~78% of the restaurants offering online delivery. But the precision is low at 0.4987, which means almost half of the restaurants which the model predicts as delivering online are not true.
Plotting ROC and AUC curve
Decision Tree Plots
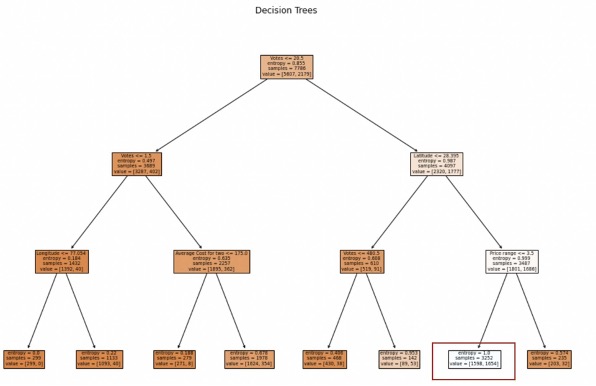
The leaf (highlighted in red box) has the highest share of online deliveries. This leaf can be reached by partitioning the data on the basis of:
Votes>20.5 ➡ Latitude>28.395 ➡ Price range >3.5
Conclusion
Using the optimization and prediction method suggested above, Adam successfully could meet his girlfriend’s demands as well as save money by optimally spending on restaurants and Uber. Also, the suggestions made by graphs, helped Adam to impress his girlfriend with smart recommendations and further strengthened their bonding.