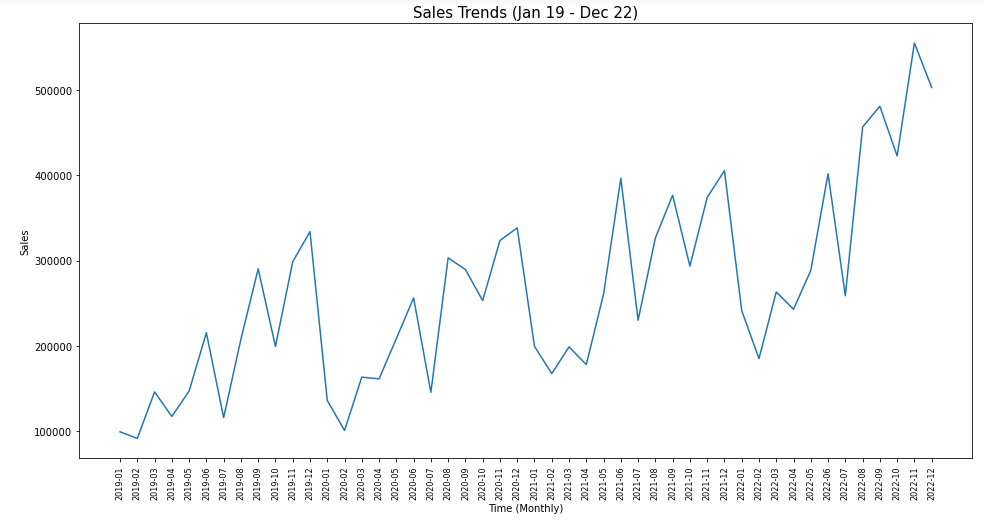
Finding 5 sales insights of sales for products:
- Sales trends
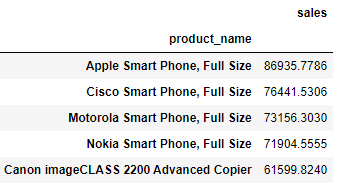
- Top 5 products by sales
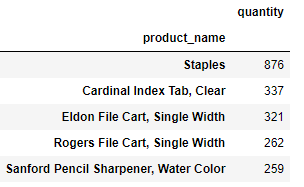
- 5 most selling products in terms of quantity
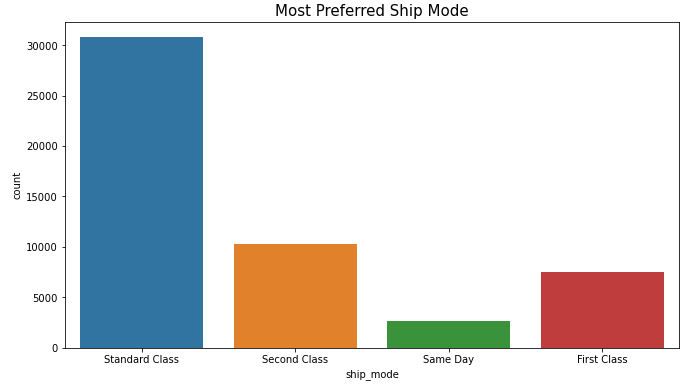
- The most commonly used mode of shipment
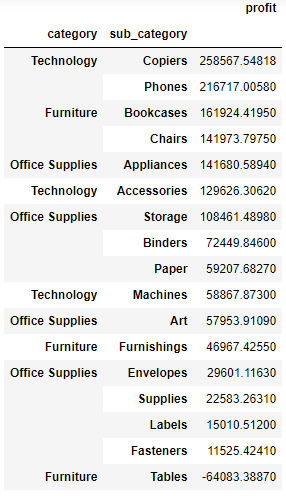
- The most profitable categories and subcategories
-
Goal - To provide sales insights those are not visible before for sales team for decision support.
-
Stakeholders - Sales and Marketing Team, Customer Service Team, Data and Analytics Team, IT Team.
-
Final Result - We have solved client queries and shared latest sales insights in order to support data-driven decision-making.
-
Data Gathering - Collecting data from Client and preparing an excel file to explore the data tables and doing data cleaning during this period as per need.
-
Importing Data - importing the datasheet in Pandas.
-
Data Auditing - checking First five rows, Last first five rows, Null or Missing Values, Info of dataset, Descriptive Summary, Shape, Columns etc
-
EXPLORATORY Data Analysis - Finding sales insight, Ploting Graphs etc.