Repository navigation
Distributions and Legends
适用版本:v1.1.0。在导言区加载 \usegradbarslibrary{distribution,legend}。
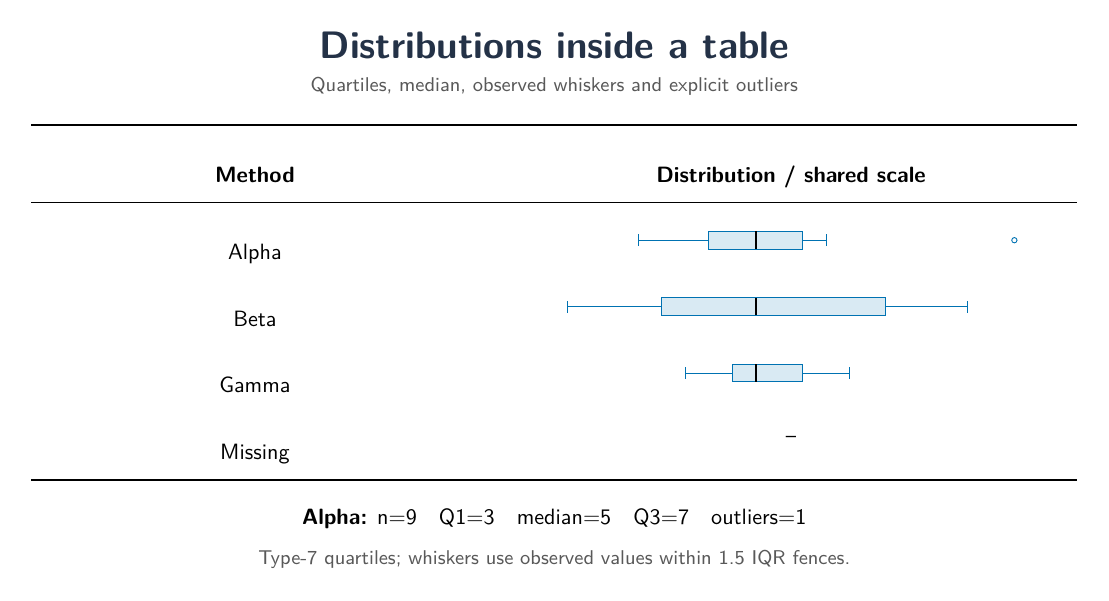
\documentclass{article}
\usepackage{gradbars}
\usegradbarslibrary{distribution}
\begin{document}
\gradboxplot[width=70mm,height=5ex,palette=accessible]{0,2,3,4,5,6,7,8,16}
\par\medskip
\gradcomputesummary{0,2,3,4,5,6,7,8,16}{%
  n=\gradstat{n}; median=\gradstat{median};
  outliers=\gradstat{outlier count}}
\end{document}- 四分位数采用 type-7 线性插值:排序后取 h=1+(n−1)p,在相邻观测间插值,p 为 0.25、0.5、0.75。
- IQR=Q3−Q1;须为闭区间
[Q1−1.5 IQR,Q3+1.5 IQR]内最远的实际观测,不是围栏坐标本身。 - 空心点表示区间外观测;它们仍参与统计,不能自动视为应剔除的数据。
- 默认自动范围包含离群点。极端离群值会压缩箱体,单纯放大宽度不一定解决;应明确解释处理方式。
- 空字段与
NA为缺失,零保留。样本数为零时显示缺失。预计算记录可用\gradboxsummary,不能从摘要验证原始样本算法。
箱线图的须不自动代表置信区间。完整统计定义
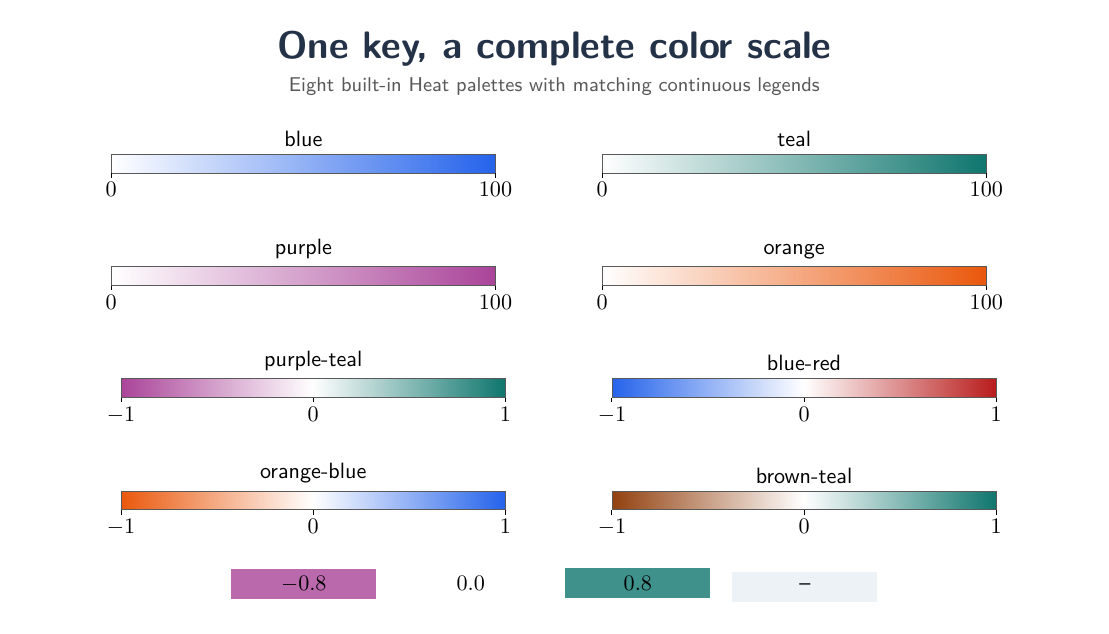
| 类型 |
heat palette 可选值 |
|---|---|
| 单向色阶 | blue、teal、purple、orange |
| 发散色阶 | purple-teal、blue-red、orange-blue、brown-teal |
例如 heat palette=purple-teal 一次设置紫—白—青;heat center=0 指定中性数值。后续显式的 heat low color、heat center color、heat high color 可覆盖预设。
\documentclass{article}
\usepackage{gradbars}
\usegradbarslibrary{legend}
\begin{document}
\begingroup
\gradscale{legend-score}{min=-10,max=30}
\gradlegenddefine{legend-score}{scale group=legend-score,
  heat palette=purple-teal,heat center=0,legend title={Score}}
\gradheat[legend group=legend-score]{-5}\quad
\gradheat[legend group=legend-score]{20}
\par\medskip
\gradlegenduse[width=60mm,height=3mm,
  legend missing=false]{legend-score}
\endgroup
\end{document}命名图例组冻结范围、配色、单位和方向,使图形与图例一致。\gradlegenduse 只接受布局与格式等覆盖,不能另行修改统计含义。
legend missing=true 默认显示缺失项;设为 false 同时隐藏该项和对应自动描述,不影响实际缺失单元格。单独画连续图例用 \gradheatlegend,类别图例用 \gradbarslegend,参考标记说明用 \gradreferencelegend。
palette=accessible 和 theme=accessible 提供色觉友好角色;print 提供打印设置。配色名称不是无障碍认证,完整 PDF 仍需检查阅读顺序和表格语义。