Repository navigation
Dashboard
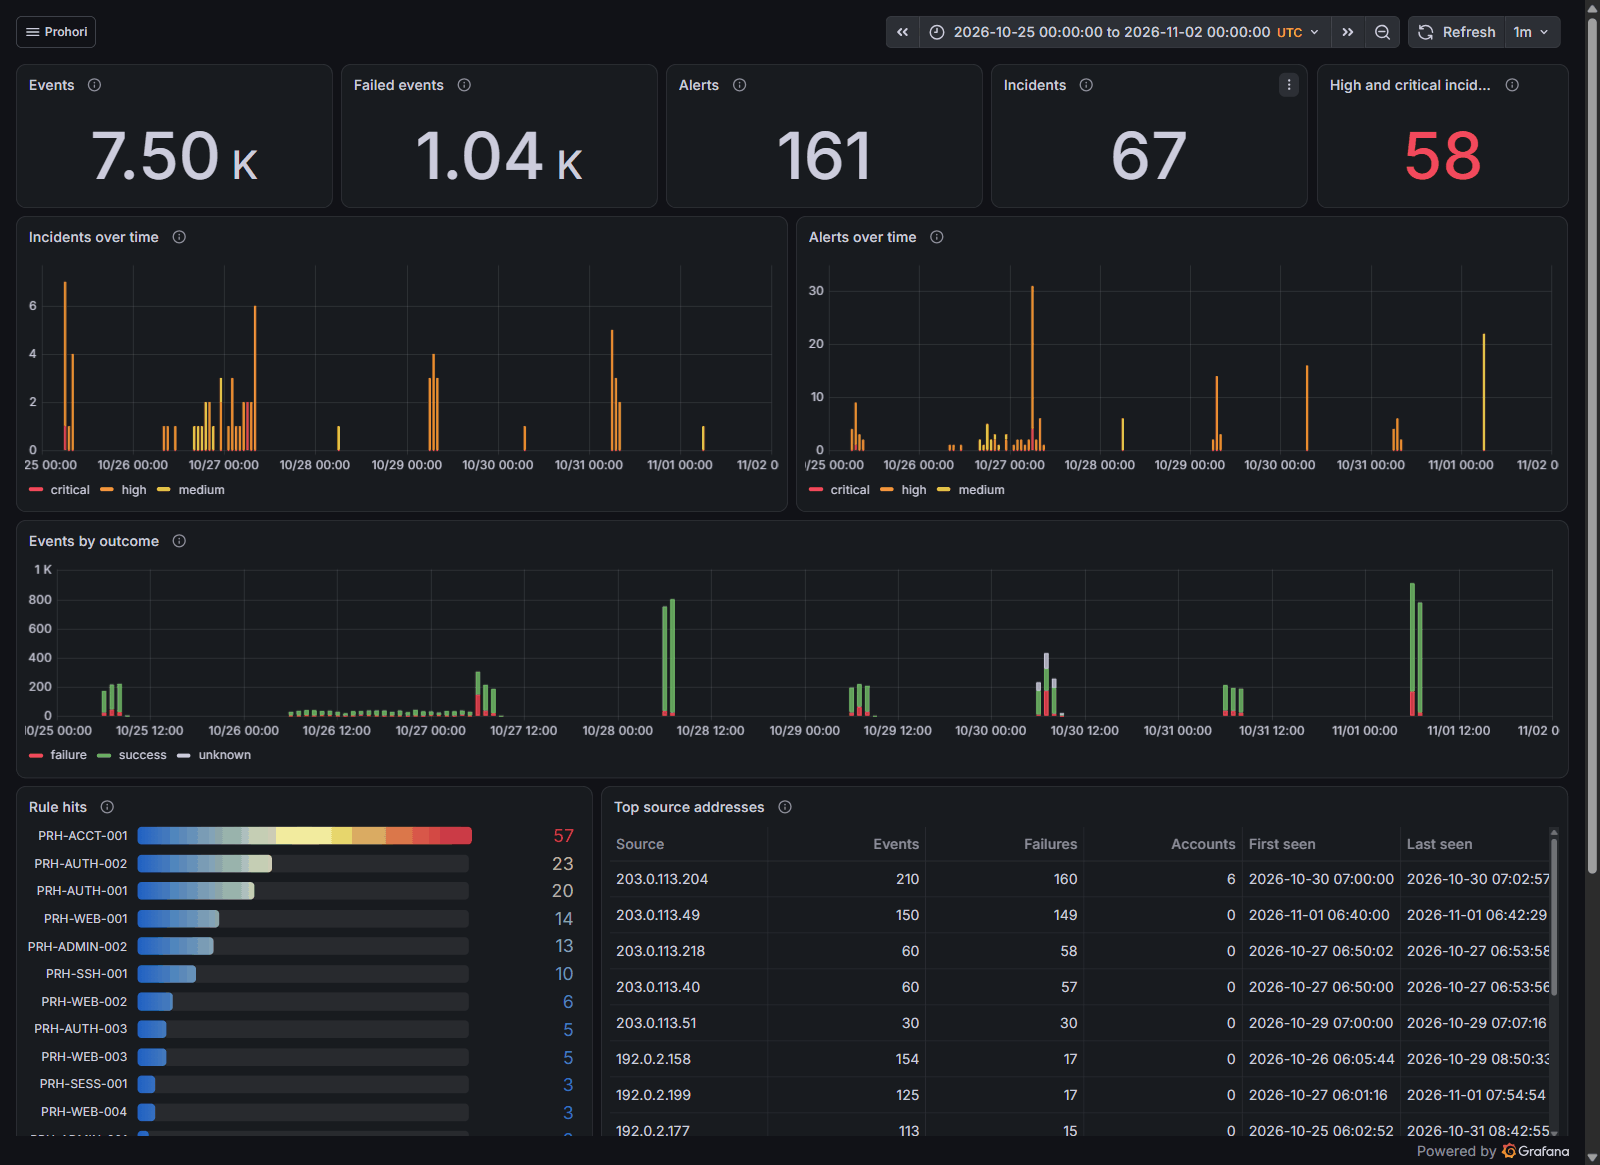
The Docker stack includes Grafana with three dashboards, provisioned from files in the
repository (pipeline/grafana/). After prohori pipeline up and a replay, open
http://127.0.0.1:13000. No login and no setup are needed. The full page is
docs/DASHBOARD.md.
Not released yet: run it from a clone.
| Dashboard | Shows | Reads |
|---|---|---|
| Overview (home page) | Events, alerts and incidents over time, rule hits, top source addresses, latest incidents | Raw tables, so it fills right after a replay |
| Detection quality | Rule precision, time to detect each simulated attack, detection latency, flow-model performance | dbt marts (Warehouse); build them with dbt build --target postgres
|
| Pipeline health | Time since the last stored event, rows stored per minute, table sizes, dead letters | Raw tables, by when rows were stored |
-
Read-only. Grafana logs in as its own database role, which can only
SELECT. Anonymous visitors get the Viewer role. -
Local only. Port 13000 on 127.0.0.1. Passwords come from the environment
(
PROHORI_GRAFANA_PASSWORD,PROHORI_GRAFANA_DB_PASSWORD), with local-only defaults. - No calls home. Usage reporting, update checks and plugin downloads are off.
- Time range. The dashboards open on the last 30 days in UTC, and Pipeline health on the last 6 hours. Widen the range for older logs.
- Tested. CI runs every panel's query through Grafana after a replay.