-
Using Ansible to Manage and Deploy Services to Kubernetes
-
Perfect for containerizing projects and managing multiple Kubernetes environments, can be Integrated with CICD Tools for DevOps
-
Derived from Project Practices, Already Deployed Multiple Kubernetes Environments
- Building and pushing container images to a container registry
- Initializing the environment (creating namespaces, storage volumes, drivers, etc.)
- Deploying monitoring tools (Prometheus, Grafana, Loki)
- Building and deploying services on Kubernetes (main use case)
- Operating System: Ubuntu 20
- Ansible Version: 2.7 (higher versions may have compatibility issues with the syntax)
- Kubernetes: Should be accessible via the
kubectlclient
The principle is simple: use ansible to manage templates and execute deployments using kubectl.
ansible-templates -> deploy.yml -> kubectl -> Kubernetes
The execution process is marked using tags, such as -t deploy for the deploy section.
Based on the execution process, it can be roughly divided into the following modules:
- base-build: Building base container images (docker build)
- push: Pushing common images to the container registry (docker pull)
- init: Environment initialization (e.g., creating namespaces)
- monitor: Monitoring and alerting (e.g., Prometheus)
- build: Building service images (docker build)
- deploy: Deploying services (kubectl apply)
- ingress: Configuring domain access (Layer 7 proxy)
Template directory: roles/k8s/templates
Subdirectories based on service types include:
- base: Base container Dockerfile
- ingress: Domain resolution configuration
- init: Environment initialization YAML files
- java: Building and deploying templates for Java JAR-based services
- jetty: Building and deploying services using Jetty
- monitor: YAML files related to monitoring and alerting
- ms: Deployment templates for microservices without separate parameter files
- nginx: Deployment templates for frontend static content using Nginx containers
For different Kubernetes environments like dev and prod, use their respective parameter configurations, such as storage, container registry, resource limits, etc.
Specify the inventory path using ansible -i and use the corresponding group variables.
For example, the Kubernetes configuration file for the dev environment is group_vars/dev/k8s.yml,
and the configuration for the app-v1 service in the dev environment is group_vars/dev/k8s_apps/app-v1.yml.
For the prod environment, use the corresponding configuration path: group_vars/prod/k8s_apps/app-v1.yml.
Export Ver=1.22.16 # k8s version
curl -ks http://elvin.vip/ks/k8s/k8s.master.ha.sh |bash

#more information https://www.cnblogs.com/elvi/p/8976305.html mkdir -p /data/ansible-app2k8s
cd /data/ansible-app2k8s
#gitee
git clone https://gitee.com/alivv/ansible-app2k8s.git ./
#github
#git clone https://github.com/alivv/ansible-app2k8s.git ./To ensure consistent versions of ansible, I have created an ansible image.
# View the shell script
cat /data/ansible-app2k8s/files/run.ansible-app2k8s.sh
sudo docker rm -f ansible-app2k8s &>/dev/null
sudo docker run -dit --net=host \
--name ansible-app2k8s -h app2k8s \
-w /data/ansible-app2k8s \
-v /tmp:/tmp \
-v /etc/hosts:/etc/hosts \
-v ~/.ssh:/root/.ssh \
-v /data/ansible-app2k8s:/data/ansible-app2k8s \
registry.cn-shanghai.aliyuncs.com/elvin/ansible:2.7.18-focal
sudo docker ps -l# Run the ansible-app2k8s container
bash /data/ansible-app2k8s/files/run.ansible-app2k8s.sh
# Set an alias
alias app2k8s='docker start ansible-app2k8s ; docker exec -it ansible-app2k8s bash'
# For Linux
echo "alias app2k8s='docker start ansible-app2k8s ; docker exec -it ansible-app2k8s bash'" >>~/.bashrc
# For macOS
echo "alias app2k8s='sudo docker start ansible-app2k8s ; sudo docker exec -it ansible-app2k8s bash'" >>~/.zshrc
# Enter the ansible-app2k8s container (Exit with Ctrl+d)
app2k8s
# Check the ansible version
ansible --versionIn this example, multiple functions are deployed on a single docker-build node.
For security reasons, it is recommended to split them into multiple nodes based on your requirements.
Modify the configuration for the dev environment node in env/dev/k8s.inv file.
# Configuration for dev environment node
cat > env/dev/k8s.inv <<EOF
[dev:children]
k8s-node
docker-build

[docker-build]
build-node1        ansible_ssh_host=192.168.23.45
[k8s-node]
k8s-node1          ansible_ssh_host=192.168.23.30

[k8s:children]
k8s-node
[docker:children]
docker-build
registry
[registry]
build-node1
EOF

#Change the IP address to your own, and the node requires passwordless login.
#The node needs to have Python 2 installed.
# apt install -y python python2 python-apt
# ln -fs /usr/bin/python2 /usr/bin/python
Configure the environment parameters for the dev environment in the group_vars/dev/k8s.yml file.
#Modify configuration IP address

k8s_version: 1.22.16

kubectl_node: 192.168.23.45
deploy_yml_node: 192.168.23.45
Ansible test
ansible -i env/dev all -m ping

#Retrieve Ansible variables.
ansible -i env/dev all -m setup# Install Docker and docker-py (dependency for building images using Ansible)
ansible-playbook docker.yml -D -i env/dev -l docker-build -t docker,py,job
# Deploy docker-registry as the image repository
ansible-playbook docker.yml -i env/dev -D -l registry -t registry,registry-auth
# Add host resolution for the image registry
ansible-playbook docker.yml -i env/dev -D -t hosts-registry
# Configure yml file storage node
ansible-playbook docker.yml -i env/dev -D -l docker-build -t yml-node
# Install NFS service and create NFS directories for storing container volumes (PVC)
ansible-playbook nfs.yml -i env/dev -D -l docker-build -t nfs-server
# Use NFS volumes, k8s nodes need to have NFS client installed
ansible-playbook nfs.yml -i env/dev -D -l k8sadd
docker-registrydeploy in k8s, update 2024
roles/k8s/templates/init/2.3.docker-registry-hub.yml
Copy the Kubernetes node configuration file /etc/kubernetes/admin.conf.
Replace the configuration file for this instance located at roles/k8s/files/kubeconfig-dev.yml.
You can manually configure the kubeconfig file, and the file path should be configured in group_vars/dev/k8s.yml.
#Install and configure the kubectl command-line tool .
ansible-playbook k8s.yml -i env/dev -D -l build-node1 -t kubectl,kubeconfig

#kubectl test command: kubectl get nodes
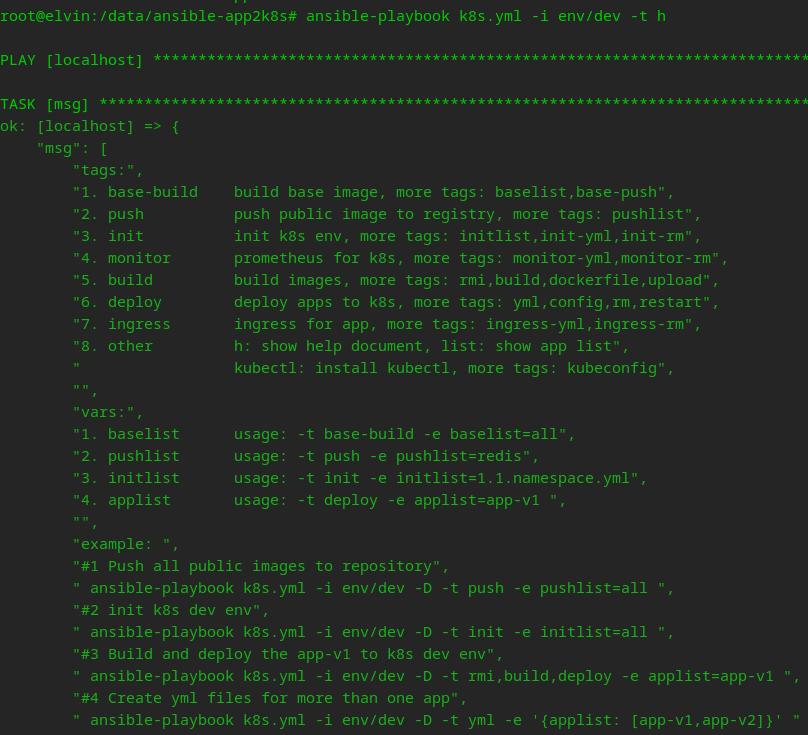
ansible-playbook k8s.yml -i env/dev -D -t kubectl-test#View help.
ansible-playbook k8s.yml -i env/dev -D -t h
#View the list of resources.
ansible-playbook k8s.yml -i env/dev -D -t listBuild image for testing
#View the list of Dockerfiles for base images.
ansible-playbook k8s.yml -i env/dev -D -t baselist

#Build image nginx_1.22-alpine-www
ansible-playbook k8s.yml -i env/dev -D -t base-build -e baselist=nginx_1.22-alpine-www

#构建完成后打开镜像仓库web查看镜像
#默认账户密码 admin docker
#添加本地host解析后打开 http://hub.elvin.vip
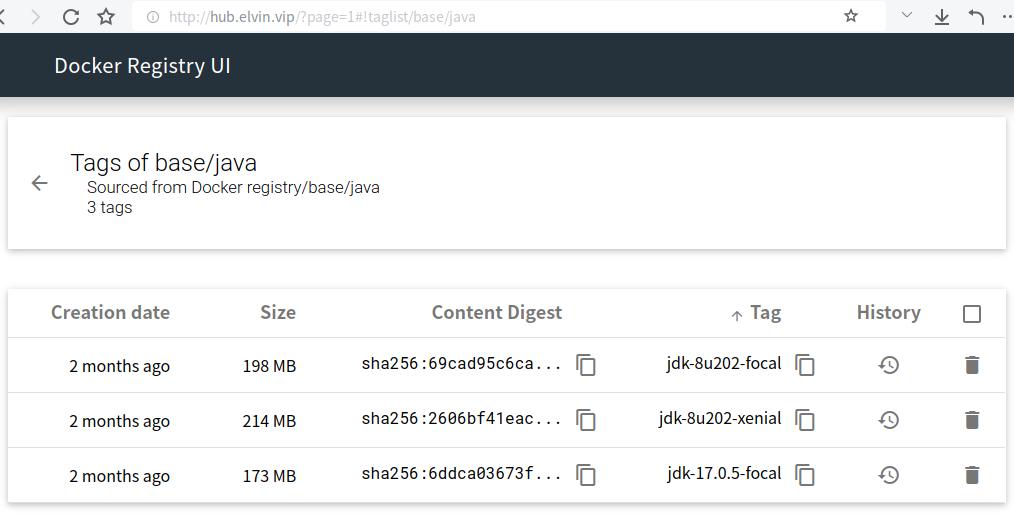
# After building is completed, open the image repository web interface to view the images.
# The default username and password are admin and docker .
# Add a local host entry to resolve the domain and then open http://hub.elvin.vip.#View the list of images to push
ansible-playbook k8s.yml -i env/dev -D -t pushlist
#Push all images (This may take some time)
ansible-playbook k8s.yml -i env/dev -D -t push -e pushlist=all# View the list of YAML files for initialization
ansible-playbook k8s.yml -i env/dev -D -t initlist
# Execute initialization for all YAML files
ansible-playbook k8s.yml -i env/dev -D -t init -e initlist=all#Alert notifications are sent using DingTalk bots. Please replace it with your own bot token.
grep notice_dingtalk_token group_vars/dev/k8s_ui.yml
# View the list of monitoring components
ansible-playbook k8s.yml -i env/dev -D -t monitorlist
# Deploy all monitoring components
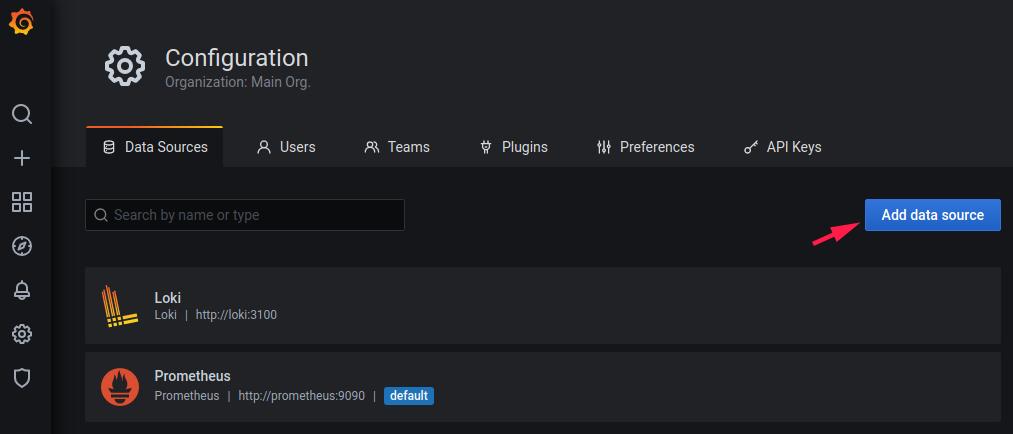
ansible-playbook k8s.yml -i env/dev -D -t monitor -e monitorlist=allGrafana default username/password: admin / grafana
Add Loki data source URL: http://loki:3100
Add Prometheus database source URL: http://prometheus:9090
Grafana templates: roles/k8s/templates/monitor/grafana-template/
# View the app list
ansible-playbook k8s.yml -i env/dev -D -t applist

# Test, build, and deploy app-v1
ansible-playbook k8s.yml -i env/dev -D -t build,deploy -e applist=app-v1

# Build and deploy all
ansible-playbook k8s.yml -i env/dev -D -t build,deploy -e applist=all
ansible-playbook k8s.yml -i env/dev -D -t ingressTo view the ingress configuration,
open the following URL in a web browser:
# Add local hosts resolution
ansible-playbook dev.yml -i env/dev -D -t hosts-local

# View the configured URL list and test them in a web browser
ansible-playbook dev.yml -i env/dev -t url
After testing, clean up the dev deployment in Kubernetes
# Remove ingress
ansible-playbook k8s.yml -i env/dev -D -t ingress-rm

# Remove services in the dev environment
ansible-playbook k8s.yml -i env/dev -D -t rm -e applist=all

# Remove monitoring
ansible-playbook k8s.yml -i env/dev -D -t monitor-rm

# Remove environment initialization
ansible-playbook k8s.yml -i env/dev -D -t init-rmansible-playbook k8s.yml -i env/dev -D -t rmi,build,deploy -e applist=app-v1
ansible-playbook: Executes the Ansible playbook command line.k8s.yml: Name of the playbook file in the current directory.-i: Specifies the inventory node path.-Dor--diff: Displays file modifications during the execution process.-tor--tags: Executes the specified tag sections. Multiple tags can be separated by commas.-eor--extra-vars: Specifies variables from the command line. Command line variables take precedence.-Cor--check: Performs a dry-run or trial run, used to check the execution process.
For easier management and maintenance, this example uses static storage for the Persistent Volume Claim (PVC). When using PVC, subPaths are added to the mount path for each service. A cronJob is used to compress and clean up log files stored in the PVC every day. The supported storage types include NFS, Alibaba Cloud NAS, Tencent Cloud CFS, AWS EFS, and Azure Files. The files with the prefix "1.4.pvc" in the path roles/k8s/templates/init are related to storage configuration.
- Configuring log4j2 to store quantifiable logs in ElasticSearch.
- Configuring log4j2 to store logs in files and mounting the PVC to the container.
- Using Loki to collect terminal logs, with Grafana as the UI interface.
The log4j2 configuration can be found in the configmap at roles/k8s/templates/jetty/configmap/.
The deployment YAML paths for the following tools can be found in
roles/k8s/templates/init/
-
8.4.1 Automatic HTTPS Certificate Renewal with
cert-managerOfficial Website: cert-manager GitHub: cert-manager/cert-manager Notes:- Configure your own
cert-ssl-issuer.yml. - For HTTP authentication, ensure that the domain is correctly resolved to the public IP.
- For DNS authentication, follow the instructions in the official documentation to configure DNS resolution permissions.
- Configure your own
-
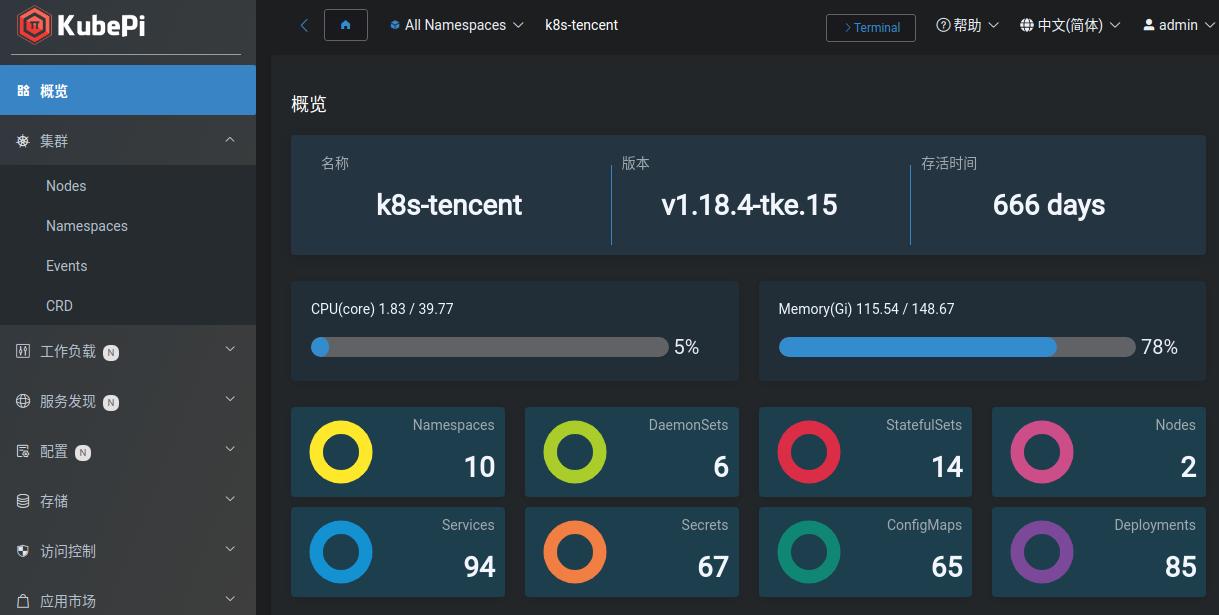
8.4.2 Kubernetes Dashboard:
KubePiKubePi is a visual dashboard for Kubernetes that can manage multiple Kubernetes clusters. It is an open-source project from China. GitHub: 1Panel-dev/KubePi -
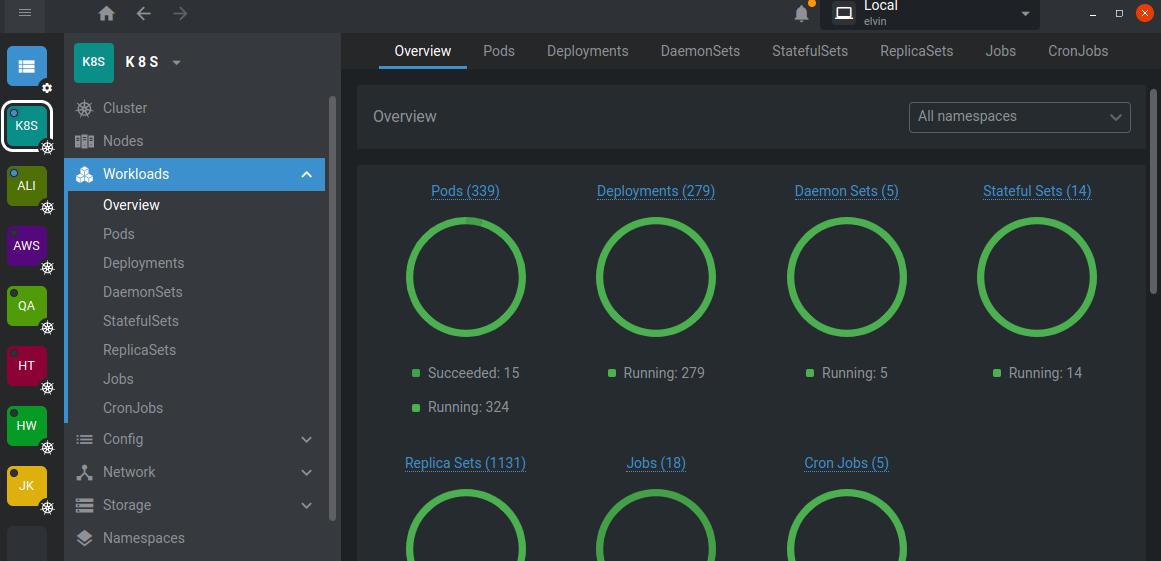
8.4.3 Kubernetes Dashboard IDE:
LensOfficial Website: Lens -
8.4.4 Kubernetes User Permission Management:
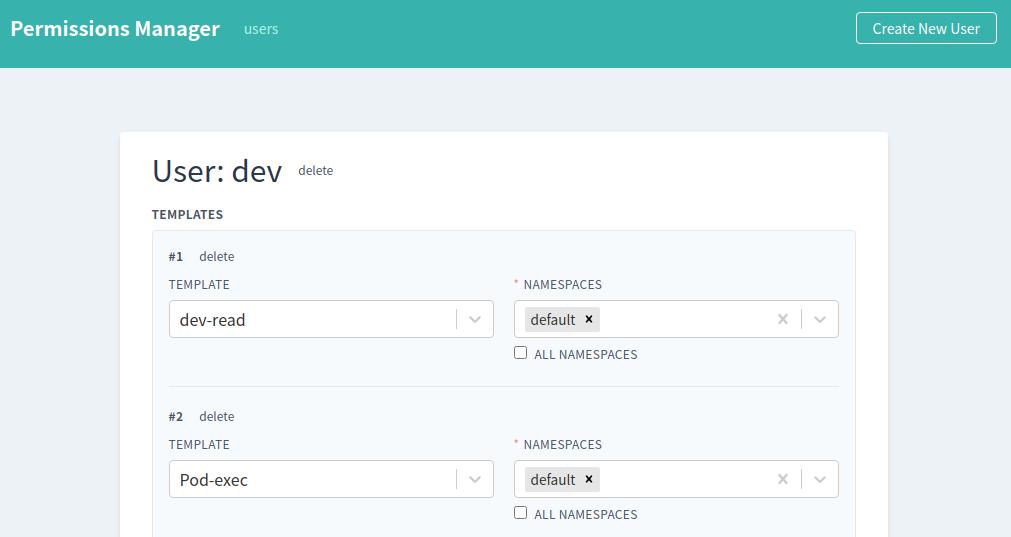
permission-managerPermission Manager allows you to add and configure user permissions and generate user kubeconfig files. GitHub: sighupio/permission-manager
- Stateful services are deployed using the StatefulSet method and require PVC (Persistent Volume Claim) mounting.
- Since stateful services are rarely changed after deployment, they are placed in the
initcategory, and the YAML files have a prefix ofdata. - For example, Redis:
roles/k8s/templates/init/3.data-redis-standone.yml. - In the testing environment, a single node is sufficient. For production environments, it is recommended to use native cloud services.
The monitoring solution is based on Prometheus and includes the following modules:
- node-exporter for collecting node metrics
- kube-state-metrics for aggregating container state metrics
- metrics-server for aggregating resource metrics
- prometheus for collecting, storing, and querying metrics
- alertmanager for managing monitoring alerts and routing
- grafana for visualizing metrics on UI dashboards
- dingtalk for sending alert notifications via DingTalk bots
Other Monitoring Components
- prometheus-adapter for container autoscaling
- loki for log storage and querying
- promtail for collecting logs and sending them to Loki
Monitoring and Alerting Rules
The Prometheus configuration file prometheus-config.yml contains the collection and alerting rules. The alerting rules include:
- CPU, memory, and disk utilization of Kubernetes nodes, as well as available disk capacity
- Pod status, CPU, and memory utilization limits for containers
- Other services such as JVM, Redis, RabbitMQ
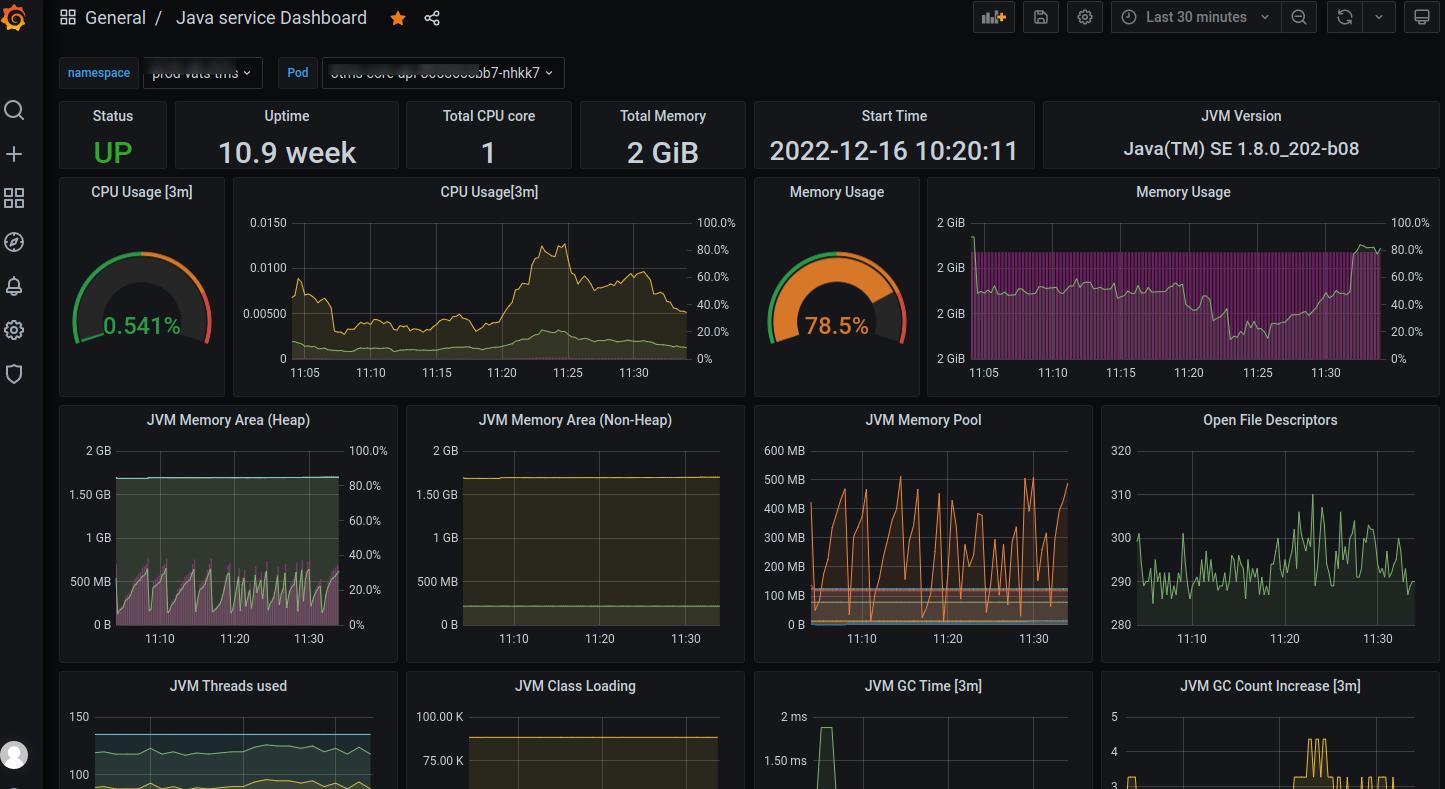
Grafana Dashboards
Grafana dashboard view for JVM monitoring:
For standalone deployment of docker-registry, you can refer to my blog post:
Docker Registry Setup
If deploying services to a public cloud, it is recommended to use the native image storage service provided by the cloud provider.
- docker-registry - Container image registry
- docker-registry-ui - Web interface for viewing registry images
- Building and pushing images to the registry
- Image building does not include source code compilation. You can modify the download URLs in the Dockerfile as needed.
- Other tools, such as Jenkins (source code compilation) -> storing compiled packages -> image building -> image registry
There are three registry URLs configured in the settings (both private and public):
local_repository_url: Default push to the local image registrypush_repository_url: Push to a remote image registrydeploy_repository_url: Image registry used during deployment
Please address security concerns according to your needs. Here are some considerations:
- Secure access control for YAML storage nodes
- Use ansible-vault to encrypt ansible password files
- Manually configure kubeconfig and restrict access to the k8s-apiserver
- All deployment steps and templates can be modified as needed, providing high flexibility.
- All k8s configurations and deployment operations are saved as YAML files, making it easier for future upgrades, migrations, and maintenance.
- If you are familiar with ansible, you can use this project as a reference for managing k8s deployment services.
- Automated deployment should be combined with other tools, such as Jenkins.
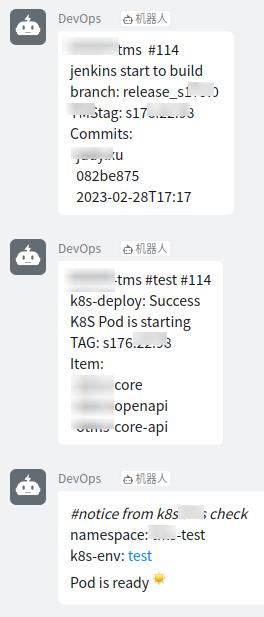
Automated Deployment Notification using Jenkins, Ansible, and DingTalk:
# View Dockerfile changes after modifying build parameters
ansible-playbook k8s.yml -i env/dev -D -t dockerfile -e applist=app-v1 -C

# View deployment changes after modifying deployment parameters
ansible-playbook k8s.yml -i env/dev -D -t yml -e applist=app-v1 -C

# After modifying configmap configuration, the service needs to be restarted to take effect
ansible-playbook k8s.yml -i env/dev -D -t config,restart -e applist=app-v1

# Build and deploy the service, rmi is used to remove existing images with the same tag on the build node
ansible-playbook k8s.yml -i env/dev -D -t rmi,build,deploy -e applist=app-v1

# Deploy to production environment, upload the image to the registry
ansible-playbook k8s.yml -i env/prod -D -t upload,deploy -e applist=app-v1

# After modifying Prometheus monitoring alert rules, reload is required to take effect
ansible-playbook k8s.yml -i dev -D -t monitor-config,monitor-reloadBy Elvin, hi@elvin.vip
Main Blog: blog.elvin.vip

