Repository navigation
H0 Plot Options
The Plot Options popover in the header allows you to customize the appearance of most plots produced by Conduit-Summit. Click the Plot Options button in the top-right header to access these controls.
Not all options apply to every plot — some plots have a fixed structure that doesn't support certain customizations. In those cases, the relevant options are simply ignored.
If you need customization beyond what is offered here, the underlying conduitR and ggplot2 packages can be used directly in R to generate plots of arbitrary complexity.
Controls the overall aesthetic of ggplot2-based plots. Available themes:
ggprism:
- ggprism — Prism-style publication plots (ggprism docs)
ggplot2 built-in themes (ggplot2 docs):
- theme_classic — Simple theme with axes but no gridlines
- theme_bw — Black-and-white theme with gridlines
- theme_dark — Dark background with white gridlines
- theme_void — No background, gridlines, or axes
- theme_light — Light background with faint gridlines
- theme_minimal — Minimalist theme
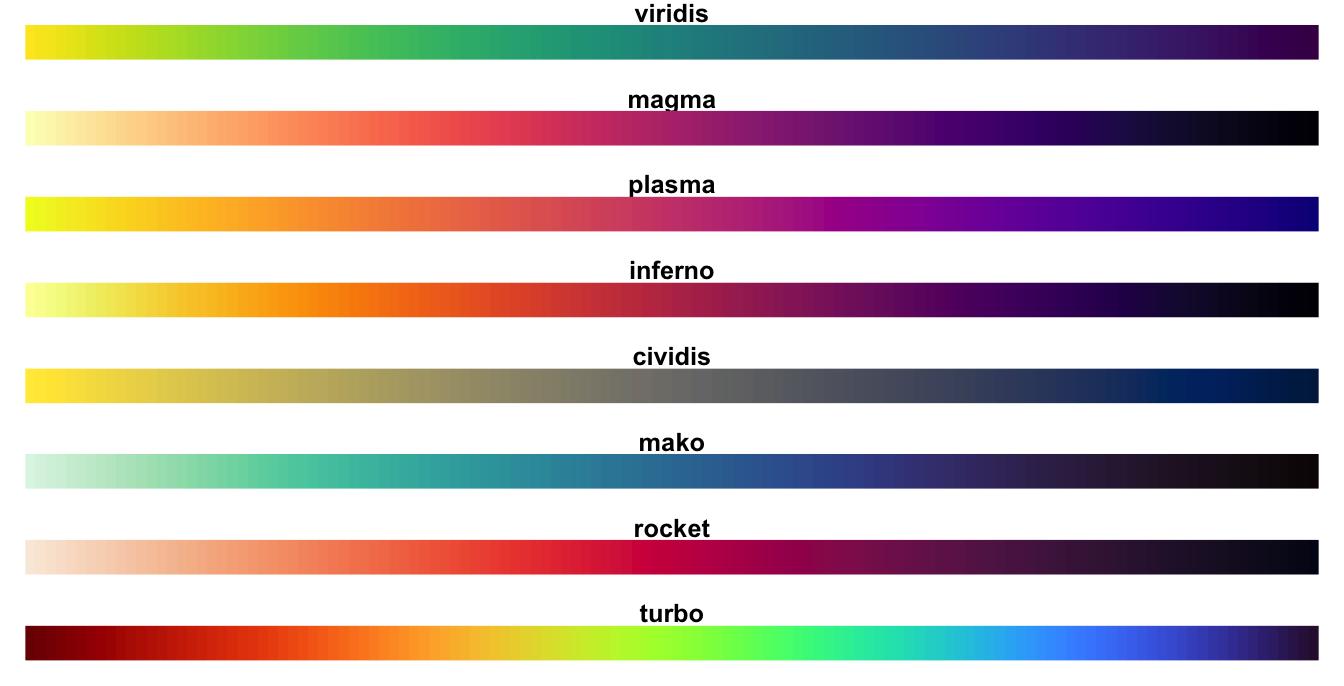
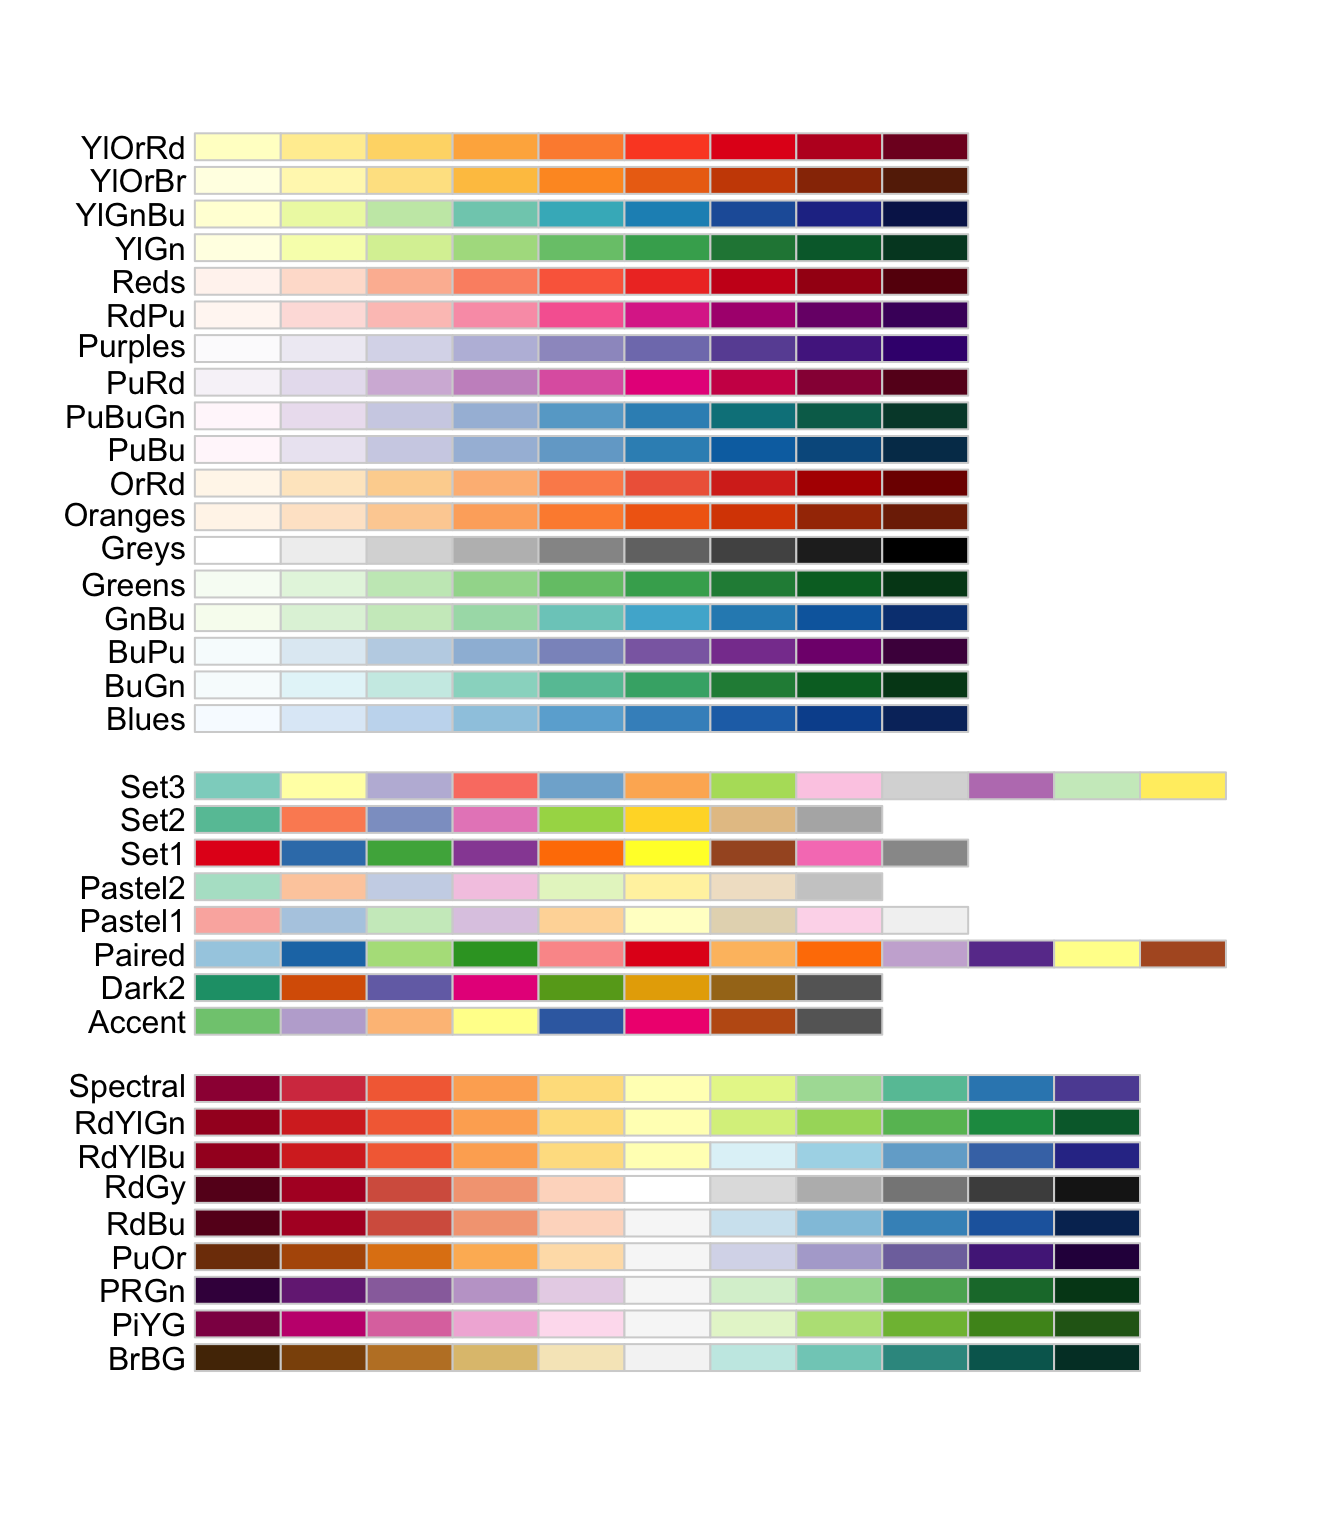
Controls the color palette used in plots. A range of qualitative and sequential palettes are available.
Choose the output format when saving plots via the Download Plot button:
- png
- svg
- jpeg
- tiff
- eps
Width of the saved plot in inches.
Height of the saved plot in inches.
The Download Plot button in the header saves the currently displayed plot using the format and dimensions specified above.