Repository navigation
Benchmarks
How Celeris's building blocks compare with what a mod would otherwise use: the JDK's own classes and the best-known
Java libraries for the same job, and what that adds up to on a real server. Every number below comes from JMH benchmarks
run on the machine described in each section. The in-game numbers come from
bichal-build-logic's perf-test workflow.
Measured: 2026-10-08, Celeris 0.2.3 (commit 4586d93) with Velox 0.1.0. Machine: 4 vCPU Intel Xeon @ 2.1 GHz (shared cloud VM, AVX2), Linux, OpenJDK 21. Harness: JMH 1.37, 1 fork, 3 × 1 s warm-up, 5 × 1 s measurement (± is JMH's 99.9 % error). A shared VM is noisy: read differences under ~20 % as a tie. Your numbers will differ; the ratios are what matter.
| Job | Celeris | Compared with | Result |
|---|---|---|---|
| A server with 20,000 dropped items, Minecraft 1.21.1 | 18.3 ms per tick (Velox + native kernel) | 243.0 ms, vanilla NeoForge | 13.3× faster, from about 4 TPS to a full 20 |
| The same on Minecraft 26.1 | 35.2 ms per tick | 225.8 ms, vanilla NeoForge | 6.4× faster |
| Compressing mod data (38 KiB) | native zstd, 542 MiB/s, ratio 5.5× | Java Deflater level 6 (what Minecraft uses), 42 MiB/s, ratio 5.8× |
12.8× faster for nearly the same size |
| Decompressing it | 1,296 MiB/s | Java Inflater, 417 MiB/s |
3.1× faster |
| Same, vs zstd-jni 1.5.7 | 542 / 1,296 MiB/s | 454–489 / 1,218–1,302 MiB/s | tie: same zstd 1.5.7 underneath, in a 2 MB jar instead of a 7.4 MB one |
| Moving 10,000 dropped items one tick | 0.97 ms (native kernel) | 1.35 ms (same rules in Java, item by item) | 1.4× faster |
| 32,768 items on 3 threads | 0.88 ms | 4.72 ms (Java, one thread) | 5.3× faster, under 2 % of a 50 ms tick |
| Finding touching items in a pile of 16,384 | 0.24 ms | 860–1,100 ms (every pair counted, as before 0.3.0) | ~4,000× faster |
| One worker handing results to the game thread | 39.5 M/s | JCTools MpscArrayQueue 8.0 M/s, ArrayBlockingQueue 4.3 M/s |
4.9× faster than JCTools |
| Two or three workers at once | 13.0 / 12.8 M/s | JCTools 8.7 / 9.7, ArrayBlockingQueue 4.9 / 3.8 |
1.3–1.5× faster than JCTools |
| 100,000 items travelling on 200-block pipes, one tick | 101 µs | 261 µs (one object per item, moved item by item) | 2.6× faster; on 20-block pipes a tie (326 vs 317 µs) |
| Building a 10,000-block pipe network (a chunk or world load) | 2.7–3.9 ms (addNodes) |
45 ms (grid) to 8,966 ms (one long straight run), adding blocks one by one | 12× to 3,300× faster |
Where Celeris is not the fastest, this page says so: LZ4 compresses 2.3× faster than zstd, at the price of output about 40 % larger (3.9× instead of 5.5×). The native physics kernel is 7–20 % slower than in the previous build of this page, because it now checks every item for impossible values and computes block coordinates without undefined behaviour (see Batch physics); on a real server that is lost in the rest of the tick.
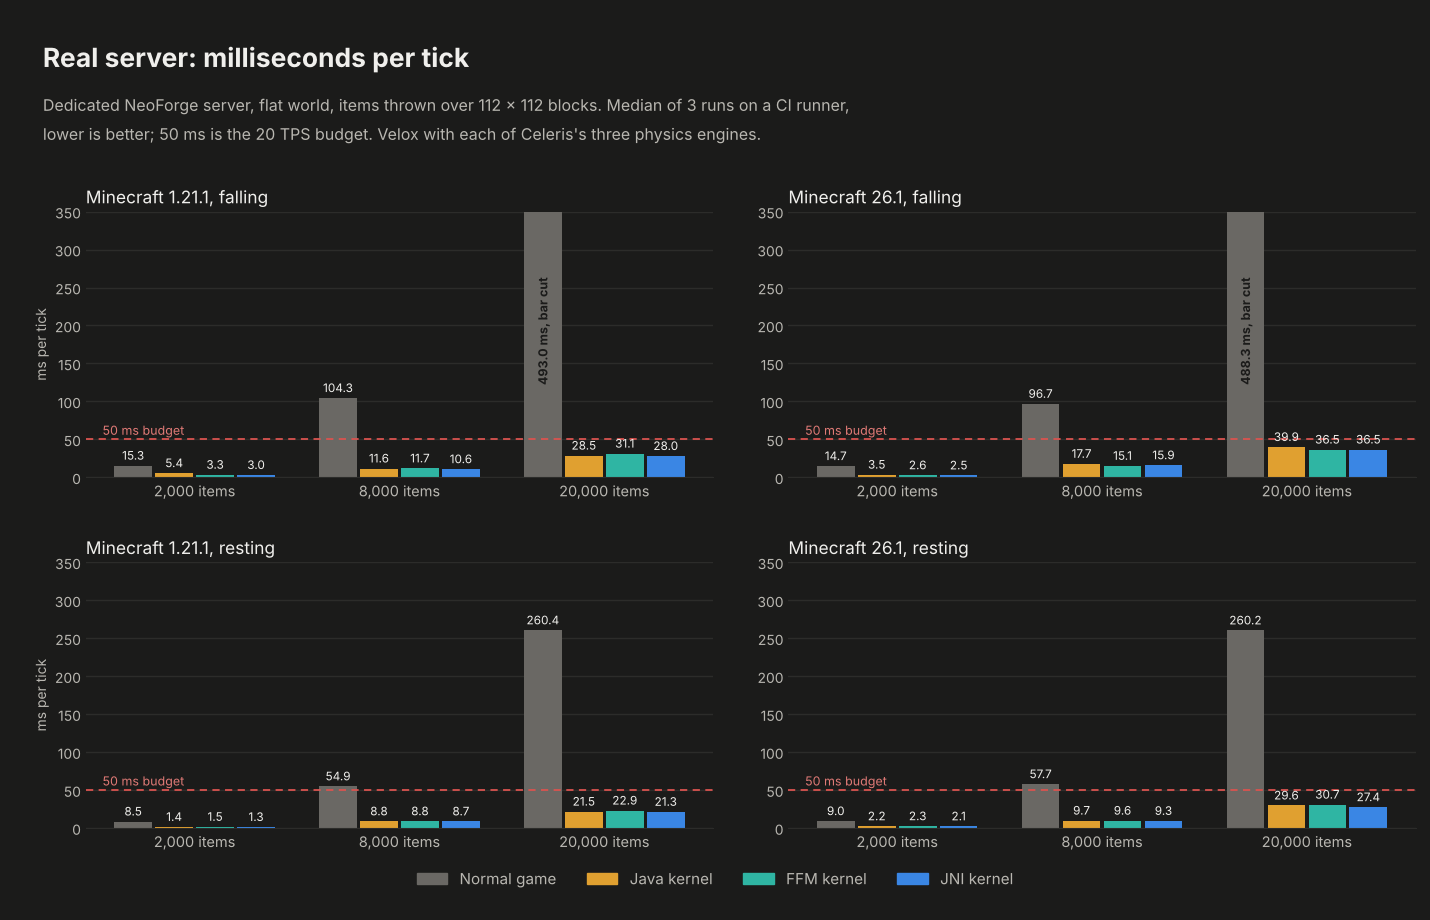
A dedicated NeoForge server on a GitHub Actions runner (4 vCPU), flat world, N swords thrown over a 112 × 112 area
(swords never stack, so every configuration keeps all of them). Vanilla's tick sprint runs ticks back to back and
reports the average milliseconds per tick: falling is the first 80 ticks after the throw, resting 1,200 ticks
later with everything on the ground. Milliseconds per tick, lower is better; 50 ms is the 20 TPS budget. Re-measured on
2026-10-29 with Celeris and Velox at main (GitHub run bichal/BichalBuildLogic 40922919248), one run per cell on a
shared runner, so read differences under ~20 % as a tie:
| Minecraft | Items | Vanilla falling / resting | Velox (native kernel) falling / resting | Speed-up |
|---|---|---|---|---|
| 1.21.1 | 2,000 | 11.26 / 8.54 | 3.04 / 1.34 | 3.7× / 6.4× |
| 1.21.1 | 8,000 | 91.23 / 54.40 | 11.36 / 6.32 | 8.0× / 8.6× |
| 1.21.1 | 20,000 | 447.09 / 243.02 | 25.66 / 18.32 | 17.4× / 13.3× |
| 26.1 | 2,000 | 11.71 / 7.70 | 2.63 / 1.89 | 4.5× / 4.1× |
| 26.1 | 8,000 | 70.71 / 52.17 | 16.98 / 9.74 | 4.2× / 5.4× |
| 26.1 | 20,000 | 296.56 / 225.84 | 41.35 / 35.17 | 7.2× / 6.4× |
With Celeris's Java kernel instead of the native one the server is within a few percent (20,000 items resting: 19.52 ms on 1.21.1, 33.80 ms on 26.1): the item physics itself is now a small part of the tick, and what remains is Minecraft's own per-entity work (chunk ticking checks, entity tracking, fluid checks), which Velox leaves to the game. On 26.1, 0.3.0's Velox also skips the per-item "entity inside block" walk for items over plain blocks, which took 4× to 7.5× at 20,000 resting items.
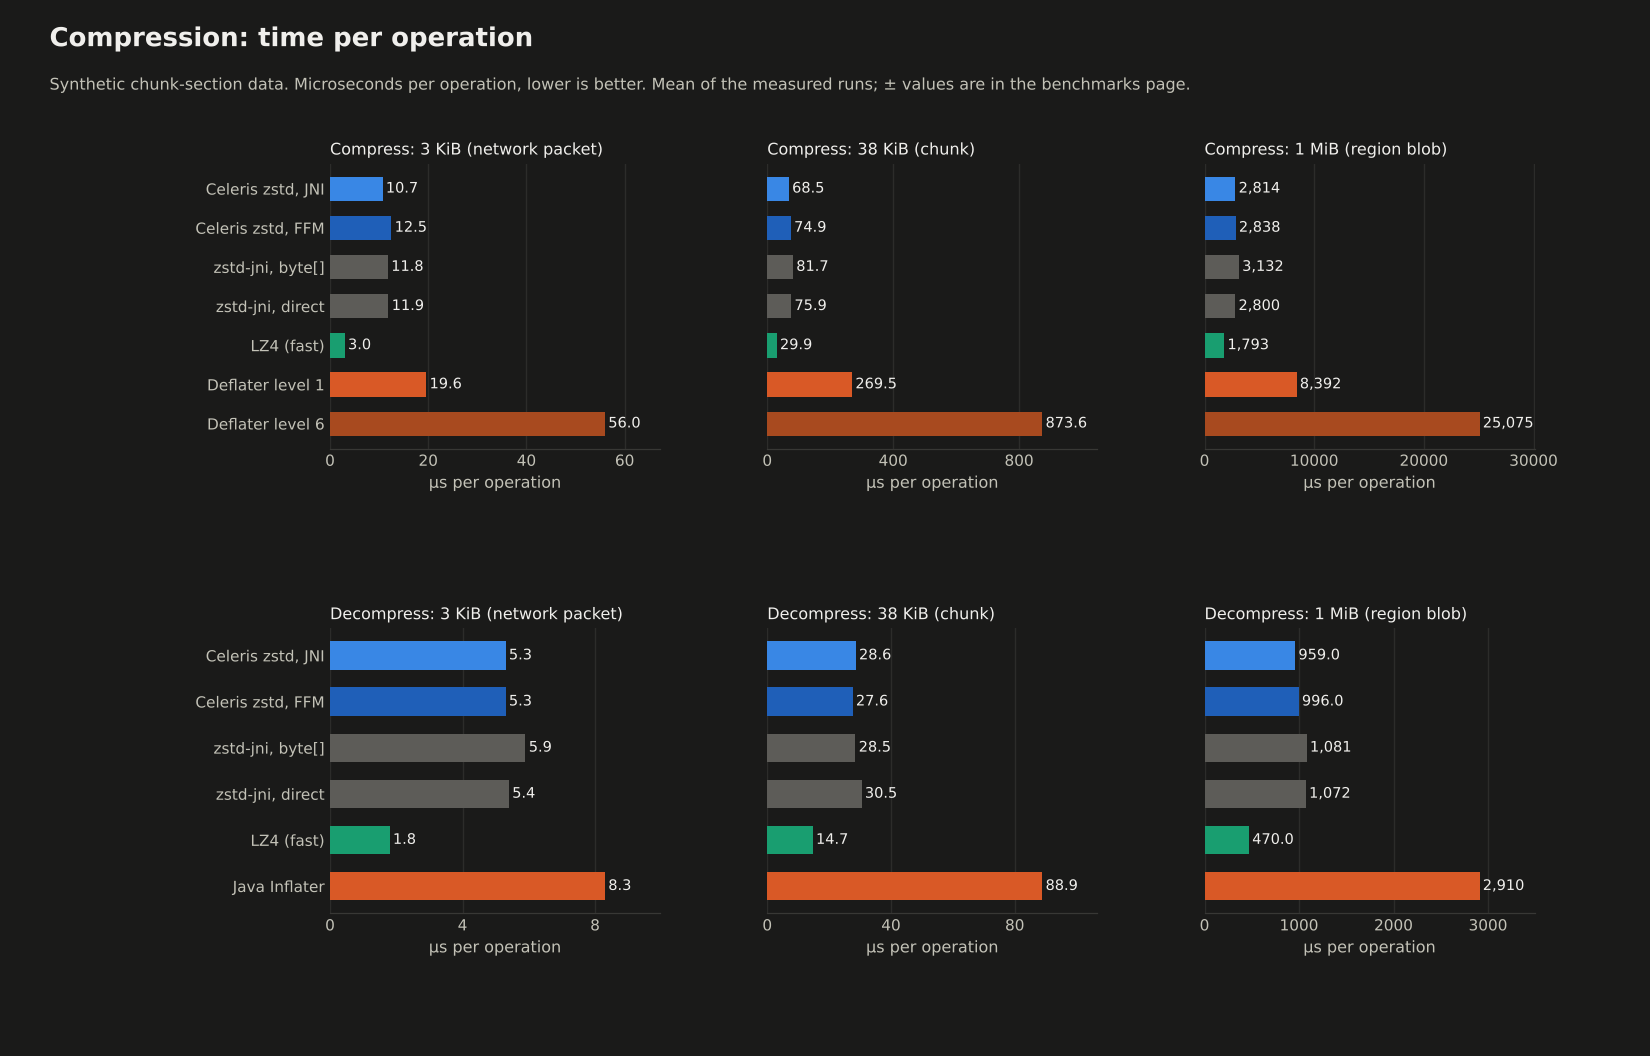
Synthetic chunk-section data (NBT-like palettes and block states, see ChunkData.java) at three sizes: one network
packet (3 KiB), one chunk (38 KiB) and a region-sized blob (1 MiB). Time per operation in µs, lower is better:
| 3 KiB | 38 KiB | 1 MiB | |
|---|---|---|---|
| Celeris zstd, compress (JNI binding, Java 21 without flags) | 10.7 ± 1.5 | 68.5 ± 12.1 | 2,814 ± 609 |
Celeris zstd, compress (FFM binding, --enable-preview / Java 25) |
12.5 ± 8.9 | 74.9 ± 23.0 | 2,838 ± 640 |
zstd-jni 1.5.7-6, compress (byte[]) |
11.8 ± 3.4 | 81.7 ± 58.0 | 3,132 ± 887 |
| zstd-jni 1.5.7-6, compress (direct buffers) | 11.9 ± 4.4 | 75.9 ± 24.5 | 2,800 ± 446 |
| LZ4 (lz4-java 1.8.0, fast), compress | 3.0 ± 0.2 | 29.9 ± 1.6 | 1,793 ± 473 |
Java Deflater level 1, compress |
19.6 ± 5.7 | 269.5 ± 38.4 | 8,392 ± 1,322 |
Java Deflater level 6, compress |
56.0 ± 11.0 | 873.6 ± 176.7 | 25,075 ± 4,713 |
| Celeris zstd, decompress (JNI) | 5.3 ± 0.7 | 28.6 ± 6.9 | 959 ± 134 |
| Celeris zstd, decompress (FFM) | 5.3 ± 0.7 | 27.6 ± 5.5 | 996 ± 261 |
zstd-jni, decompress (byte[]) |
5.9 ± 1.6 | 28.5 ± 10.2 | 1,081 ± 434 |
| zstd-jni, decompress (direct) | 5.4 ± 0.9 | 30.5 ± 13.3 | 1,072 ± 476 |
| LZ4, decompress | 1.8 ± 0.1 | 14.7 ± 2.1 | 470 ± 88 |
Java Inflater
|
8.3 ± 1.0 | 88.9 ± 22.9 | 2,910 ± 417 |
Compression ratio (original ÷ compressed):
| 3 KiB | 38 KiB | 1 MiB | |
|---|---|---|---|
| zstd level 3 (Celeris and zstd-jni) | 4.43 | 5.51 | 6.38 |
| Deflater level 6 | 4.81 | 5.83 | 6.30 |
| Deflater level 1 | 4.22 | 5.07 | 5.37 |
| LZ4 | 2.95 | 3.88 | 4.35 |
What this means: zstd gives deflate-level-6 sizes at better-than-level-1 speed. Celeris's own binding costs nothing over zstd-jni's (both are one native call into the same library, with pooled contexts), and it ships inside a 2 MB jar that also carries the physics kernel and every platform's natives. Packets between players still use deflate, so clients and servers on different Java versions always agree; zstd is for mods' own data (saves, caches, bulk transfers).
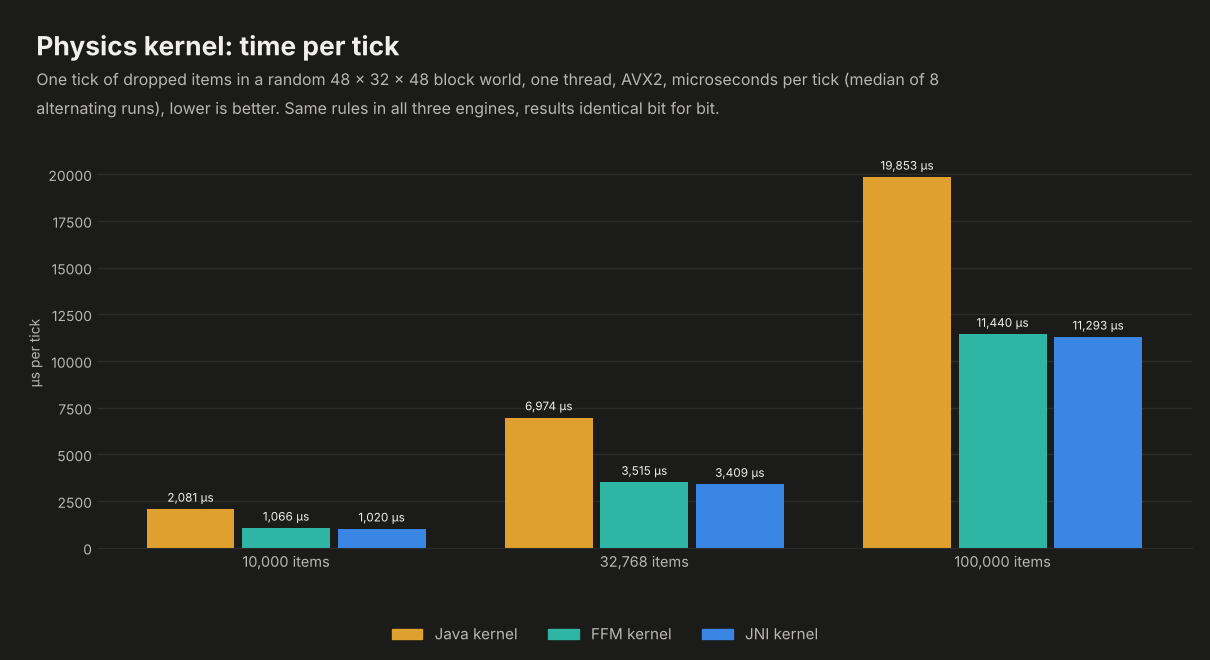
One game tick of N dropped items in a random 48×32×48 block world: gravity, drag, collision with blocks and ground friction, following vanilla's item movement rules. The items are thrown again every 40 ticks so the batch never just rests. "Java" is Celeris's pure-Java kernel, which applies the rules one item at a time the way vanilla does; it does not include the rest of vanilla's per-entity cost (entity ticking, events, tracking), so vanilla itself is slower still. Time per tick in µs:
| Items | Java kernel | Native kernel (AVX2) | Speed-up |
|---|---|---|---|
| 1,000 | 129.5 ± 49.4 | 97.3 ± 14.7 | 1.3× |
| 10,000 | 1,349.5 ± 321.7 | 973.3 ± 235.6 | 1.4× |
| 32,768 | 4,721.0 ± 2,058.9 | 3,171.3 ± 489.3 | 1.5× |
| 32,768, 3 worker threads | 1,454.3 ± 427.3 | 882.6 ± 163.5 | 1.6× (5.3× vs one Java thread) |
Both kernels now refuse items whose position, speed or size is not a finite, plausible number (NaN, infinity,
1e300, billions of blocks away) and leave them to vanilla, and they compute block coordinates through a clamp, so no
input can make them read or write outside their buffers or hit undefined behaviour in C++. That costs: measured in
the same session against the build before those checks, the step is 7–13 % slower at 10,000 items and 12–21 % at
32,768 (callgrind: +11 % instructions on the baseline ISA). Results for every normal item are unchanged, bit for
bit, between the Java and native kernels on every CPU (PhysicsParityTest), and AddressSanitizer/UBSan check the
native one on x86-64 and ARM in CI (native-sanitizers.yml).
The native kernel is picked automatically when the CPU and JVM allow it (AVX2, AVX-512 or NEON builds ship in the jar); otherwise the Java kernel runs with identical results.
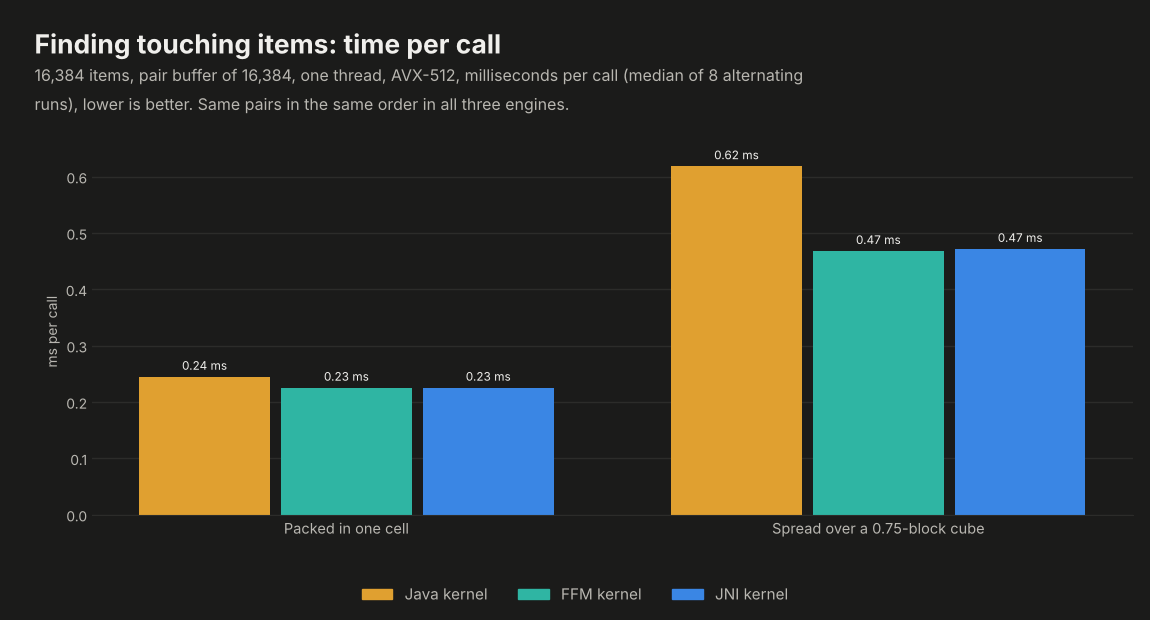
BodyBatch.broadphase lists the pairs of items whose boxes touch (merge candidates, pushing). A pile of n items in
one block is the worst case: nearly every pair touches, ~n²/2 of them. Before 0.3.0 every call counted them all;
now the scan stops once the pair buffer (here n pairs) is full, and reports that the list was cut. The pairs kept are
exactly the first ones of the full list, in the same order on the Java and native kernels. Time per call:
| Items | Kernel | Every pair counted (before) | Stops at the buffer (0.3.0) | Speed-up |
|---|---|---|---|---|
| 4,096 | Java | 62.7 ± 23.7 ms | 0.061 ± 0.025 ms | ~1,000× |
| 4,096 | native | 58.1 ± 8.8 ms | 0.056 ± 0.010 ms | ~1,000× |
| 16,384 | Java | 924 ± 534 ms | 0.232 ± 0.055 ms | ~4,000× |
| 16,384 | native | 934 ± 180 ms | 0.244 ± 0.046 ms | ~3,800× |
Once the scan stops early, what is left is hashing every item into a cell and sorting them by cell, the same work on both kernels, so Java and native are level (the native broadphase is now compiled per ISA like the step; built for the baseline ISA only it was 15–20 % behind Java here).
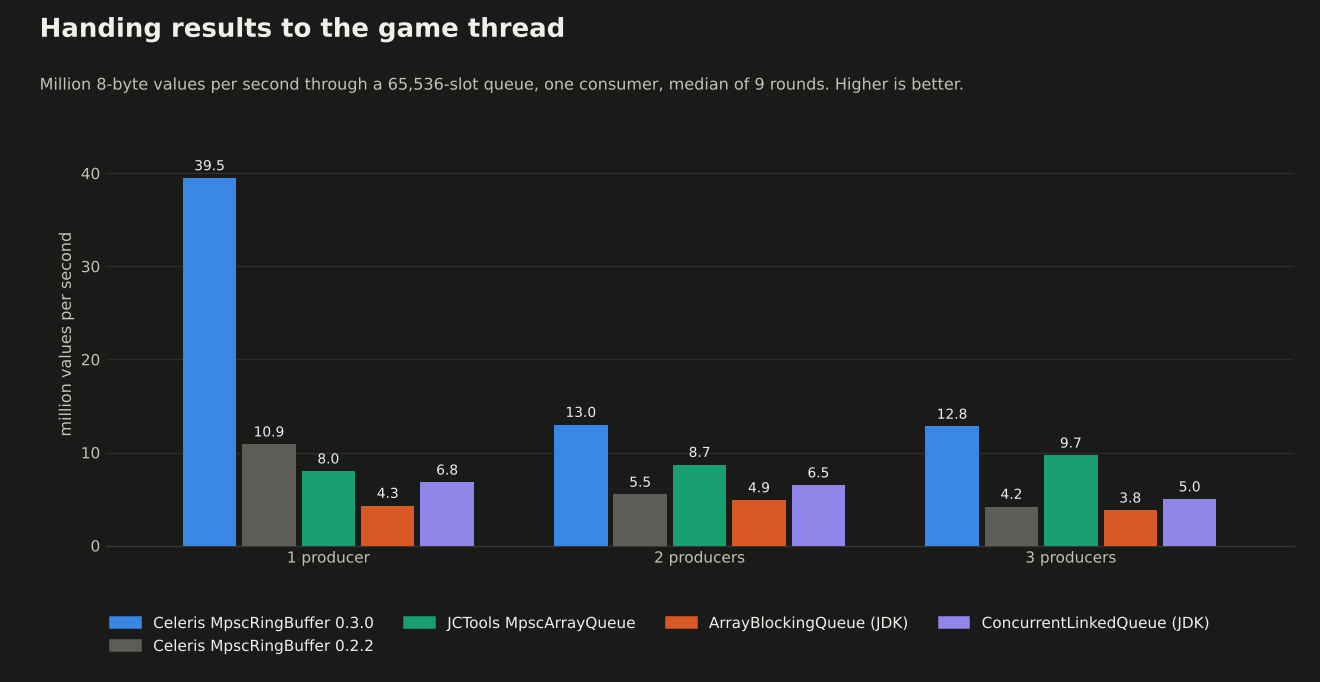
The pattern Celeris is built around: worker threads produce 8-byte results (tickets, handles, packed positions) and the game thread consumes them. Each round moves 20 million values through a 65,536-slot queue; producers spin when it is full, the consumer when it is empty. Median of 9 rounds, in million values per second:
| Queue | 1 producer | 2 producers | 3 producers |
|---|---|---|---|
Celeris MpscRingBuffer (0.3.0) |
39.5 | 13.0 | 12.8 |
Celeris MpscRingBuffer (0.2.2) |
10.9 | 5.5 | 4.2 |
JCTools MpscArrayQueue 4.0.5 |
8.0 | 8.7 | 9.7 |
ArrayBlockingQueue (JDK) |
4.3 | 4.9 | 3.8 |
ConcurrentLinkedQueue (JDK) |
6.8 | 6.5 | 5.0 |
Celeris stores the values themselves in off-heap slots; the object queues box each one into a Long, which is part of
their cost and is what a mod using them for primitive results pays too. 0.3.0 made the ring about 4× faster with one
producer: producers no longer read the consumer's position on every publish (they keep a cached limit), and each
slot's state word now sits next to its payload, so a hand-off touches one cache line instead of two. (The 0.2.2 row
was measured on the same machine on 2026-10-07; the others on 2026-10-08.)
TransitSolver moves items along the segments of a SegmentedGraph: per direction of each segment, flat arrays of
progress, speed and handle, advanced a tick at a time, with spacing between items and a hand-over at the junctions
(routers decide where an item goes; the order is canonical, so the result does not depend on how the segments happen
to be stored). One tick of items circulating on square loops of pipe, microseconds per tick, lower is better:
| Items | Pipe length | Celeris solver | Same, scalar advance | One object per item |
|---|---|---|---|---|
| 2,000 | 20 blocks | 3.7 ± 0.7 | 3.8 ± 1.0 | 5.3 ± 1.4 |
| 2,000 | 200 blocks | 1.6 ± 0.1 | 1.5 ± 0.1 | 3.8 ± 0.6 |
| 20,000 | 20 blocks | 43.9 ± 8.7 | 40.8 ± 8.1 | 54.9 ± 16.5 |
| 20,000 | 200 blocks | 17.4 ± 0.6 | 18.3 ± 1.6 | 38.8 ± 3.8 |
| 100,000 | 20 blocks | 325.9 ± 39.6 | 383.0 ± 71.1 | 317.0 ± 34.4 |
| 100,000 | 200 blocks | 101.0 ± 13.2 | 94.4 ± 13.0 | 260.6 ± 31.7 |
What this says, and what it does not:
- With long pipes the flat layout is 2.2–2.6× faster than objects at 20,000 items and up. The work is a straight walk over arrays instead of a pointer chase per item.
- With short pipes (a junction every 20 blocks) the object version keeps up: at 100,000 items it is a tie. Most of the time then goes to handing items over at junctions, which both versions do item by item. Do not expect a gain there from the solver; the gain is that its state is plain data that can be saved, mirrored to clients and migrated when the network changes.
- The vector advance is not measurably faster than the scalar loop (within noise at every size): advancing the
positions is not where a tick's time goes (spacing and hand-overs are). It is used above 64 items per queue and gives
bit-identical results to the scalar path (the advance is one IEEE add per item;
TransitSolverTest), so it costs nothing, but do not count on it for speed. - An early version gathered every queue into big arrays and sorted arrivals globally; it was slower than the object baseline. The shipped version steps queue by queue and orders arrivals through a sorted copy of the segments that is rebuilt only when the network changes.
Measured 2026-10-21 on the same kind of VM as above (4 vCPU, AVX2, OpenJDK 21), same JMH settings, benchmark
TransitBench.
One tick with 200,000 to 8 million items on straight 100-block lines (TransitScaleBench; microseconds, lower is
better). Flowing: every item moves and each line is fed one item every third tick (the feeding is in the tick).
Backed up: the consumers refuse everything and the lines are full, so nothing can move. Measured 2026-10-22 on a
4 vCPU Intel Xeon (shared cloud VM), OpenJDK 25, JMH 1 fork, 3 × 2 s warm-up, 5 × 2 s measurement.
| Items in flight | Backed up, before | Backed up, now | Flowing, before | Flowing, now | Flowing, 3 workers |
|---|---|---|---|---|---|
| 200,000 | 310 | 29–32 (10×) | 335–371 | 396–443 | not worth it (below 200,000) |
| 2,000,000 | 4,260 | 1,040–1,100 (4×) | 4,960 | 5,260–6,170 | 2,930 (1.9×) |
| 8,000,000 | 29,100 | 4,800–6,000 (5–6×) | 34,700 | 38,000–42,400 | 17,500 (2.4×) |
- A queue whose items are all pressed against the one ahead and whose head waits at the exit cannot change until something is added or removed, so its tick is skipped. What remains is trying to route each waiting head.
- Flowing items are as fast as before to within noise (a few percent slower at the smallest size: the pass now also
notes whether the queue is settled once its head reaches the exit).
TransitSolver.setWorkersshares the pass over the items with worker threads; routing stays on the caller, in the same order, andTransitScaleTestchecks that positions, deliveries and events are identical to a single thread walking every item, tick after tick.
addNodes(ids, masks, count) adds many blocks in one call and fuses once, instead of re-tracing the neighbourhood for
every block. 10,000 pipe blocks, milliseconds, lower is better (BulkBuildBench):
| Layout | One by one | addNodes |
Speed-up |
|---|---|---|---|
| One straight run (every block extends it) | 8,965.7 ± 297.8 | 2.7 ± 0.5 | ~3,300× |
| 100 × 100 grid, junction every 20 blocks | 45.2 ± 7.3 | 3.9 ± 0.5 | ~11.5× |
The straight run is the worst case for one-by-one fusion (each block re-traces the whole run, so the cost grows with
the square of its length), which is why the gap is so large; real worlds look more like the grid. The result of
addNodes is the same set of segments as adding one at a time (SegmentedGraphBulkTest checks it against a
brute-force trace of every network it builds).
Every benchmark that exists in the repository, where it lives and how to run it. The @Tag("benchmark") tests are
excluded from test and run with ./gradlew benchmarkTest (add -Pbichal.native.build=true to build and measure the
native kernel). The JMH benchmarks (*Bench) belong to the bench harness and Velox, not to this repository's tests.
| Benchmark | Measures | Where |
|---|---|---|
PhysicsBackendBenchmarkTest |
Step time per body of the Java, FFM and JNI engines, in batches of 1,024 and 16 | this repo, benchmarkTest
|
RingBufferBenchmarkTest |
MPSC throughput against ArrayBlockingQueue, LinkedBlockingQueue, ConcurrentLinkedQueue
|
this repo, benchmarkTest
|
Nearest3BenchmarkTest |
Nearest-of-3 query, packed-long loop against the int[] kernel |
this repo, benchmarkTest
|
TransitBench |
Items in pipes, flat layout against objects | JMH, sections above |
BulkBuildBench |
addNodes against adding blocks one by one |
JMH, sections above |
In-game perf-test
|
Server tick time with N dropped items | bichal-build-logic workflow |
Re-run on 2026-10-29 on a developer laptop, to check the engines after the fixes in this change (not comparable with
the cloud-VM numbers above: different CPU, a Windows desktop, Java 21 with --enable-preview, 20 logical CPUs, one
trial of the harness, jdk.incubator.vector active). Best of five trials, one thread, 100,000 bodies:
| Machine | Engine | Batches of 1,024 | Batches of 16 |
|---|---|---|---|
| Intel Core i7-13700H, Windows 11, Zulu 21 | Java | 113.6 ns/body (11.36 ms per tick) | 117.4 ns/body (11.74 ms per tick) |
| FFM | 74.8 ns/body (7.48 ms per tick) | 88.4 ns/body (8.84 ms per tick) | |
| JNI | 73.2 ns/body (7.32 ms per tick) | 79.8 ns/body (7.98 ms per tick) |
The native engines are about 1.5× faster than the Java kernel here, in line with the 1.3–1.6× of the table in
Batch physics. JNI and FFM tie on large batches; JNI is about 10 % ahead on batches of 16, where the
cost of the call shows. MPSC ring buffer, median of the run: MpscRingBuffer 19.7 M ops/s, ArrayBlockingQueue
9.7 M, LinkedBlockingQueue 8.9 M, ConcurrentLinkedQueue 7.8 M (2.0× the best contender). Nearest-of-3: 48.9 ns
against 40.3 ns per query (1.21×).
The dirty queue changed in this version (growable bitset made of fixed chunks, overflow list), so it has a regression
test (LongRingDirtyQueueTest) but no throughput figure yet.