Skip to content
New issue

Have a question about this project? Sign up for a free GitHub account to open an issue and contact its maintainers and the community.

By clicking “Sign up for GitHub”, you agree to our terms of service and privacy statement. We’ll occasionally send you account related emails.

Already on GitHub? Sign in to your account

Create metric to monitor network size #3916

Closed
freimair opened this issue Jan 23, 2020 · 10 comments
Closed

Create metric to monitor network size #3916

freimair opened this issue Jan 23, 2020 · 10 comments

Comments

@freimair
Copy link
Member

freimair commented Jan 23, 2020

Having this as an issue does not feel quite right, neither does having it as a proposal. After aligning with @ripcurlx, here it is anyways.

How is our network? Well, the monitor provides some stats and we know a lot more about our network as we did before. However, we still do not know the size of the network (still an unchecked box in the monitor proposal. A recent investigation showed that a single price node encountered around 500 active clients per day which could mean that only roughly 500 * 5 price nodes = 2500 Bisq clients are active, which is a lot less than the number of downloads (around 10000) and may indicate that the active Bisq community is much smaller as we though it is. Plus, we do not know about the version spread of Bisq clients out there.

Information gained

Creating a metric that can deliver a rough estimation about the network size might bring us base information like

  • an estimation on how many Bisq clients are online at each time (= network size)
  • daily active users, weekly active users
  • beyond that, see Bisq client uptime during a 24h period
    • see if Bisq clients are always on
    • or if there is a pattern during a 24h day (clients run by day, not by night, all over the world)
  • and as a bonus, we might even get version spread info of active Bisq clients

Based on that data, we can derive more information like

  • how does BTC/AltCoin volume and value affect the network size
  • how do marketing measures affect the network size
  • how do seed node/price node/... node issues affect the network size
  • how does a (broken) release affect the network size
  • see the version spread and thus, have info how a "forced/breaking" update might affect the user base

Having such information drastically changes the information base on which strategies are designed and decisions made. Thus, much more informed decisions might become possible in the fields of update/release strategies, marketing measures, and, among others, growth considerations.

Required efforts

A lot of thought has been put into this and finally, we are confident that we can do it. My estimation of implementation efforts is as follows:

  • coming up with the idea and concept (be my guest)
  • design how to extract the data from price nodes and sending it to the monitor (500 USD)
  • deploy to every price node (150 USD per price node = 750 USD)
  • configure the monitor (500 USD)

makes a total of 1750 USD. However, getting price nodes up and connected one by one might take more than one cycle.

Technical implementation details

  • use price node log scraping
    • every client connects to a pricenode a known couple of times per timespan
    • the client reveals its version (this info is not used until now)
    • the client does not reveal its node addresses or anything else that would affect privacy
  • periodically scrape logs of every price node and send the information to the monitor (create something similar to the server health reports of seed nodes; ie. collectd, deliver the data to the monitor via client auth TLS)
  • use the calculation features of the monitor to compile and display the info mentioned above
@freimair
Copy link
Member Author

freimair commented Jan 29, 2020

spend some time on this and IMHO the proof of concept turned out even better than I expected.

TL;DR

IMO pretty good results. As expected, they are not spot on, but they certainly are close enough for our purposes.
Will proceed on simulating a more dynamic network where nodes come and go.

Setup

I created a simulation environment as follows:

Screenshot from 2020-01-29 14-36-10

  • Bisq Simulator: queries the API of the price node just as a full Bisq client does, except
    • query every 2 seconds (instead of 60)
    • only provide the Bisq version information (instread of bisq version + uid of the http client)
  • Sim Controller: can spawn lots of Bisq Simulators
  • Bisq Pricenode: run from master (removed BTCAverage though)
  • Scraper: the Device Under Test and thus, the prototype of the whole metric.
    • a shell script
    • utilizes grep, cut, sed and tail
    • runs every 21 seconds

By shortening time spans I can simulate a query rate of 10 minutes and a runtime of approx. 3h. Note that lowering the Scraper frequency will increase measurement accuracy.

Results

I spawned 50 Bisq Simulators, ie. the exact number of Bisq clients up and running in the network is 50.

I let the Scraper do its job for approx. 3 minutes and recorded every result. This is what the metric got by scraping the price node logs:
Screenshot from 2020-01-29 15-25-04

Furthermore, the Scraper extracts the Bisq version spread. My Sim Controller randomly fired up these Bisq Simulator instances:

Version Instance count
v1.2.1 6
v1.2.2 14
v1.2.3 7
v1.2.4 9
v1.2.5 14

with these results:

Screenshot from 2020-01-29 15-25-34

@freimair
Copy link
Member Author

freimair commented Jan 30, 2020

Here are the results for a more dynamic Bisq network (simulation).

TL;DR

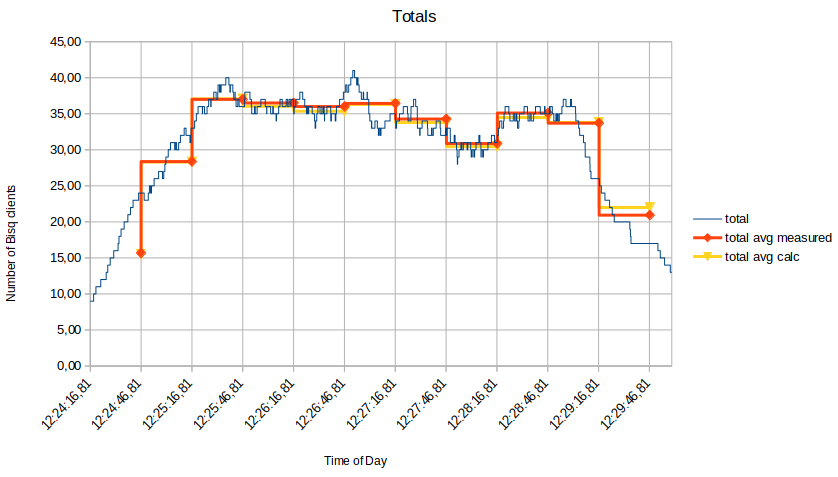
Measurement errors of 0-2% in a dynamic (simulated) Bisq network seem fine for our use case.

Setup

Same as before, except Bisq Simulators shut themselves down after a random amount of time, and new ones are fired up after random delays.

Results

The totals-graph shows the actual number of Bisq Simulators, the calculated average and the measured average. The data is gathered by the Sim Controller, spreadsheet math, and the Scraper, respectively. Please note, the slopes at the beginning and the end correlate with simulation start and fade-out.

Screenshot from 2020-01-30 13-26-41

Please find error calculations for each measurement in the "Measurement Error" graph. Again, note that the values at the beginning and the end may not be that accurate, because the simulation only started up/faded out.

Screenshot from 2020-01-30 13-42-40

All in all, I believe, an error of around 0-2% is perfectly fine for our use case.

Last but not least, here is a version spread graph. Seems a bit off, but that is because the results of the measurement period are only displayed at the very end of the period. Note that the "Totals"-Graph can also be created for each version.

Screenshot from 2020-01-30 13-48-37

@freimair
Copy link
Member Author

freimair commented Jan 30, 2020

unfortunately, we cannot extract a true xAU (as in daily/weekly/monthly active user) as that would require for clients to be uniquely identified and first, we do not have means to do so and second, we do not want that.

Are these numbers something you guys can work with? @m52go @ripcurlx ?

@ripcurlx
Copy link
Contributor

ripcurlx commented Feb 4, 2020

So the idea would be to collect within a given timeframe:

  • Number of active nodes (nodes that are part of the network)
  • Number of available offers
  • Number of trades

We'll keep an eye on the ratios between each of these numbers.

# of active nodes > # of available offers
If this conversion number increases compared to the previous timeframe, we either have attracted more market makers or improved the client and enabled the user to create an offer more easily.
To be able to check if we got more market makers on board we could monitor the offerbook to check by how many nodes the offers have been created with. If the ratio # of available offers/# of nodes stays roughly the same we can assume that the conversion increase is either by better user targeting in our growth efforts or by improvements within the client.

# of available offers > # of trades
As the trade statistics object is published already before the trade is settled (while both parties need to be online) we can't take it as a metric if we improved the trade process itself. If this conversion number increases compared to the previous timeframe, it could mean:

  • we targeted the right type of people that are happy to take existing trades
  • we improved UX that people are able to find and take existing offers more easily
  • we have enough liquidity with a reasonable spread for quick transactions

@freimair
Copy link
Member Author

freimair commented Feb 5, 2020

sounds like a plan. However, please consider that the budgeting numbers above only cover your very first point (as there is no need to change the monitoring daemon).

  • Number of available offers: is already there and can be copied to its own dashboard easily
  • Number of trades: please elaborate: number of trades per period of time? ongoing trades? successful trades? anyways, there is a need to change the monitoring daemon - minor, but has to be done
  • # of available offers/# of nodes: comes for free when we know the network size

@ripcurlx
Copy link
Contributor

ripcurlx commented Feb 5, 2020

  • Number of trades: please elaborate: number of trades per period of time? ongoing trades? successful trades? anyways, there is a need to change the monitoring daemon - minor, but has to be done
  • Number of trades == Trade statistic objects published to the network
  • Per period of time: date is in trade statistic object

sounds like a plan. However, please consider that the budgeting numbers above only cover your very first point (as there is no need to change the monitoring daemon).

Do you have a rough idea how much more effort this would be? No exact numbers, just to get an idea.

@freimair
Copy link
Member Author

freimair commented Feb 17, 2020

Do you have a rough idea how much more effort this would be? No exact numbers, just to get an idea.

until all is said and done - probably a couple of hours work - USD 450

and it will be delivered then. There is no external dependency that could slow us down as I control the monitor.

@freimair
Copy link
Member Author

I just had a call with @m52go and we agreed on utilizing the monitor for growth efforts as well.

Altogether, I will see if I can get these metrics up and running:

  • network size
  • trades per timespan

plus

  • offer creations per timespan
  • a more detailed view of the offerbook. right now, we see how many (buy/sell) offers are there per market (there)
    • volumes on offer per market (lets us see what the most important markets are for Bisq)
    • distribution of traders vs. offers per market (eg 432 trades have 25 offers each, only 31 trades have 2 offers each)
    • distribution of traders vs. volume per market (eg. 432 traders create 5 BTC of the total volume on offer, however, 31 traders create 25 BTC of volume, or the top 25% of traders (by volume) are responsible for 90% of the total volume)
    • distribution of offers vs. volume per market (eg. there are 4 offers worth 5 BTC each but there is no offer < 1 BTC)

Budgeting-wise: the offerbook enhancements will also be a couple of hours of work although more complex than the trade rate - I guesstimate I will need an additional 750 USD. Please let me know if I shall get started there as well.

  • while I am at it, I will check if we can get info on how long an offer is online until its taken. Down the road, we might use this info to get an idea on how a "good" offer looks like and why it has been taken faster than others. Actually implementing that is for another time, however.

@stale
Copy link

stale bot commented May 19, 2020

This issue has been automatically marked as stale because it has not had recent activity. It will be closed if no further activity occurs. Thank you for your contributions.

@stale stale bot added the was:dropped label May 19, 2020
@stale
Copy link

stale bot commented May 26, 2020

This issue has been automatically closed because of inactivity. Feel free to reopen it if you think it is still relevant.

@stale stale bot closed this as completed May 26, 2020
Sign up for free to join this conversation on GitHub. Already have an account? Sign in to comment
Projects
None yet
Development

No branches or pull requests

2 participants