FIT2101 Software Engineering Process and Management
Project Duration: Aug 2021 - Oct 2021
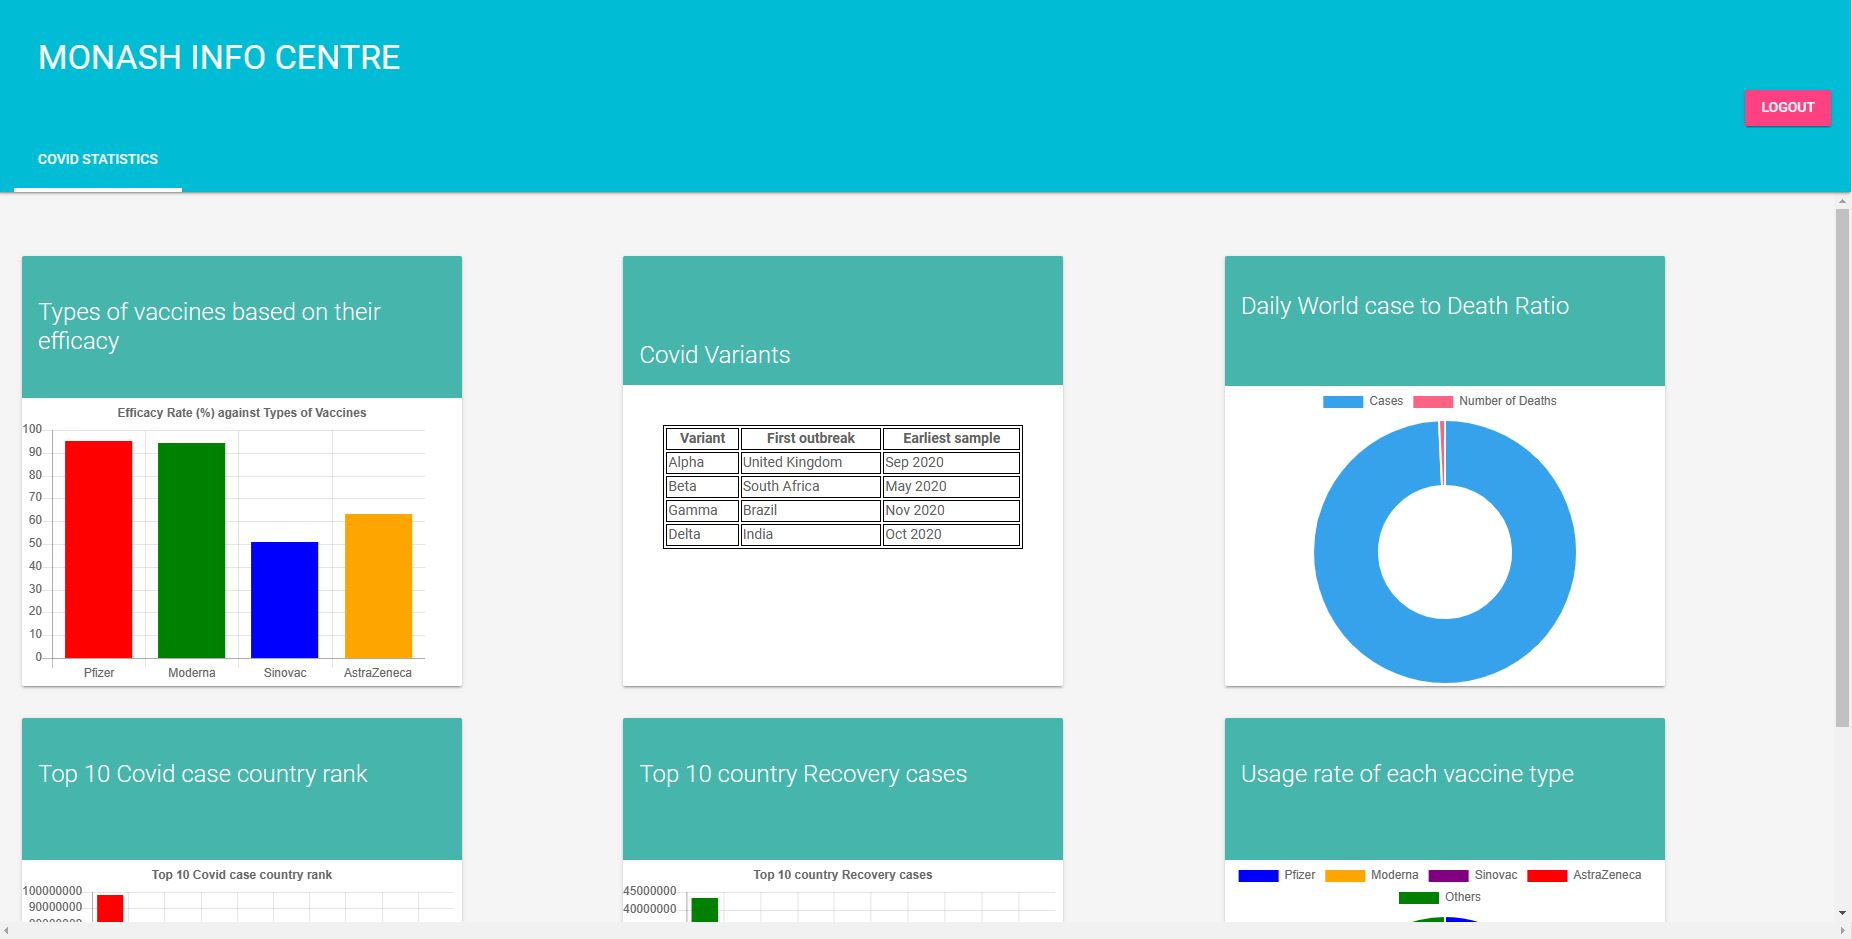
A web dashboard that displays covid statistics.
- To create an MVC framework that extracts data from official websites and displays them in different forms to the user.
- To create a product that provides users a compilation of all data regarding their desired category, thus ensuring ease of access and convenience whenever required.
Widget are ordered left to right, then top to bottom.
A graph containing the types of vaccines based on their efficiency.
A table about the different covid variants, the date of the first outbreak and the earliest sample.
A chart that shows the daily world case to death ratio.
A graph/chart that lists the top 10 ranking countries base on total covid cases.
A graph/chart that lists the top 10 ranking countries based on total recovery rate.
A chart showing the most popular vaccines used around the world.
Group: Group 5
| Name | Project Role | Execution Role |
|---|---|---|
| Kamala Velautham |
|
Client |
| Ooi Yi Sen |
|
Front-end |
| Jun Hoe San |
|
Back-end |
| Chan Wai Han |
|
Back-end |
| Joel Yang |
|
Front-end |
| Khant Hla Shwe |
|
Front-end |
| Mohammed Abidur Rashid |
|
Back-end |

