Asp.net Core not Collecting Garbage #3409
Description
Copied from #1976
@sinapis commented on Dec 19, 2017
Hi,
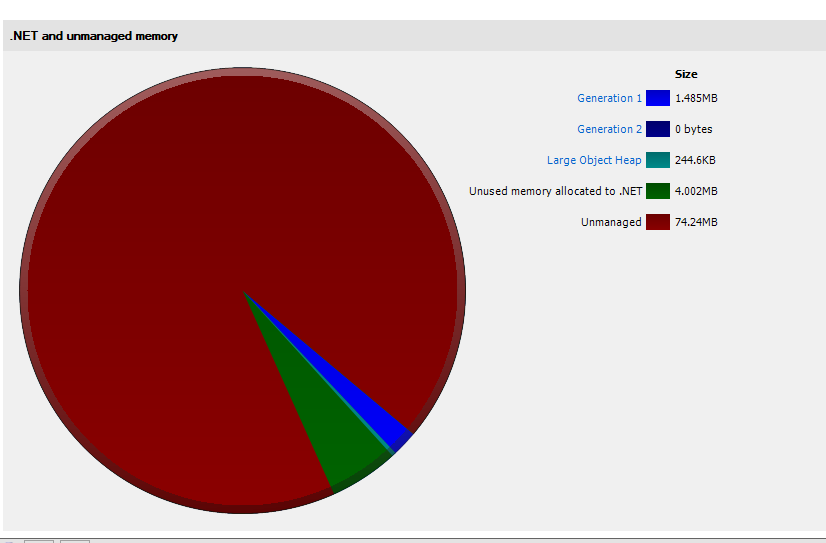
I have the same issue with ASP.NET Core 2. I've took a memory dump and tried analyzing. From what I see the problem is exactly as the OP said. My application starts with allocation about 75 MB, and very quickly it goes all the way to ~750MB, out of it 608MB is "Unused memory allocated to .NET".
First snapshot at app start:
Second snapshot after 3 minutes and 100 requests:

@sebastienros commented on Apr 5
- We only measure this on 2.1, I will look into adding the same thing for 2.0
- All comments seem to be related to to the LOH issue that was mentioned, which should be taken into account in the application and pool large arrays as much as possible
@sinapis commented on Apr 8
@sebastienros, several questions:
- I used Ants profiler to measure memory usage, according to it, no LOH fragmentation was detected. Can you advise how can I verify if my application suffers from LOH fragmentation issues?
- What are the results on .net core 2.1? Is the issue resolved because Kestrel is using Span?
- What if we can't pool arrays - can you provide a workaround? Should we use GCSettings.LargeObjectHeapCompactionMode.CompactOnce?
@davidfowl commented on Apr 8
What are the results on .net core 2.1? Is the issue resolved because Kestrel is using Span?
We personally haven't seen any evidence that the issue is in Kestrel. It still looks like an application problem.
What if we can't pool arrays - can you provide a workaround? Should we use GCSettings.LargeObjectHeapCompactionMode.CompactOnce?
@sebastienros commented on Apr 10
@sinapis
Would any of you be able to share an app that shows the issue? If I could repro it we would be able to find the reason, or at least remove some code piece by piece and isolate a minimal repro.
@sinapis commented on Apr 10
@sebastienros I can't share the app, but I can share the session from PerfView session + memory dump.
Some description: I have a ASP.NET Core 2 Web API, I've created a load test of 200 users all sending the same request over 10 seconds. Overall 775 requests were processed.
This app jumped to almost 1 GB memory usage in task manager and stayed like that. Looking at the dump I can count about 18 MB:

So the questions is where did almost 1 GB go?
@sebastienros commented on Apr 10
@sinapis Thanks
The behavior you are describing is not unexpected, the GC will allocated some memory as necessary on the peak load, and just release it over time. It's the GC Server mode, and usually wait for idle periods to release it and not affect your app perf. The amount of memory it will reserve depends of the total memory available on the system.
We would definitely see an issue if it kept increasing. I assume that if you don't send anymore requests and let your app run you will see the memory usage going down.
Could you run the same thing until it consumes most of your system memory? Or at least long enough with the same load that it will show it growing continuously? I will still get a look at your current dumps.
@sebastienros commented on Apr 10
Also can you take dumps during and at the end of the jobs, so we can see the detals.
@Maoni0 commented on Apr 11
@sinapis I looked at your ETW trace. it is puzzling to me - you survived very little in the last induced gen2 GC yet we still chose to keep that much memory committed. your application seems edge case (you mostly just did only background GCs due to LOH allocations) - I wonder if we have some accounting errors there (another possibility is errors in the numbers reported but if you already verified that you have that much committed that's a smaller possibility). if you could repro with something you can share with me, that'd be fantastic; otherwise if it's possible to run your app with some logging from GC (I can give you a commit that does that) that'd be helpful too.
@sinapis commented on Apr 11
@Maoni0 please share how should I enable GC logging
If there is some other data you would like me to provide in order to disprove accounting error please let me know what should I provide you with and how (maybe tell perfview to collect more data?)
I'll try creating a minimum repro, but not sure I'll succeed since I don't know where the problem is.
@sebastienros hopefully I will provide another dump with more memory consumption today