Repository navigation
WebClient
#Web client part of the ecodistrict design module.
The web client is the user interface of the design module. This module is used to visualize geo information in a case and its variants. It can also be used to show graphs of district wide data.
The second function of the design module is to apply measures to the whole of the district or to selected objects. These measures result in underlying data to be changed and recalculated.
The third function is to show and manipulate properties of selected objects directly.
All information is organised in domains and previews of layers and graphs can be filtered by switching domains on or off to make selection of layers and graphs easier.
From the dashboard, open the menu item "as is". In that screen there is a button "open design module". This starts the design module web application for the selected case. The browser window that opens should resemble the picture below.
There is a separate User manual for the design module web client available.
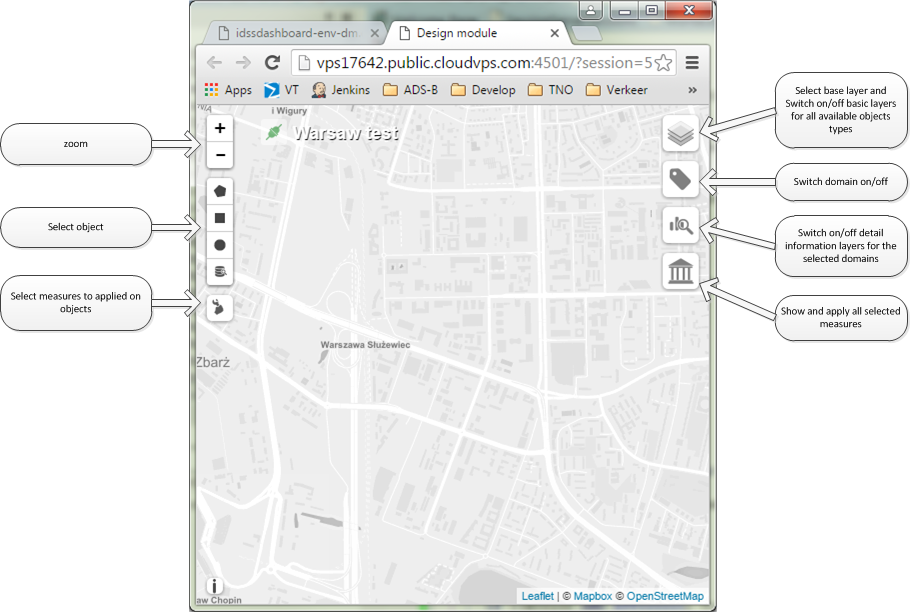
The design module can be used to apply measures to the selected opjects on the map. Choose a method of selection on left side of the screen. Hover over a button to show a hint which button selects what method for selecting objects. The selected objects will show purple on the map.
Afterb selecting objects choose a measure to applied to these objects on the left side of the screen. The list of available measures is matched to the type of the selected objects so only applicable measures show up.
If no objects are selected only measures for the whole of the district are shown.
After applying a measure it shows up in the history on the right side of the screen. All applied measures with their selected objects are listed here. No underlying data is changed at this moment.
To change underlying data for the selected case/variant choose the apply button on the measures history button on the right side of the screen; this will process all listed measures and change object values accoringly at once. Now the design module can be closed and a recalculation can be trigger from the dashboard.
On the left side of the interface of the design module there are more options to view underlying data: the base layer can be changed to grayscale/street/satellite. There are also options to show basic objects like buildings, water, trees etc. These layers contain the objects that can be selected and manipulated by applying measures to them.
Below the layers there is an icon to select domains of interest which can be switched on or off. The selection acts as a filter for the details per domain shown under the icon below the domains.
The details icon shows previews of the information layers, graphs and kpis to be shown on or over the map by selecting them.
The green or red connection icon in the upper left corner shows the state of the connection to the back-end service. The connection can be severed or re-established by clicking the icon.