Repository navigation
Metrics cheat sheet
Every column you can add to the dashboard, the campaign / offer / landing lists and the report builder, with the formula Orbitra uses. Pick columns in Columns (or ⚙ on the dashboard); hovering a column header in a table shows a short hint too.
Abbreviations and affiliate slang (CPA, RevShare, FTD, COD…) are explained in the Glossary.
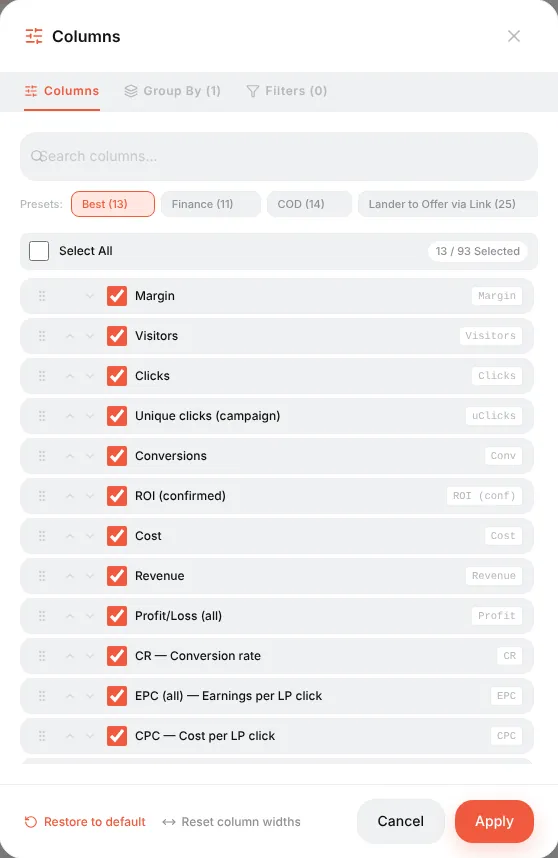
Ready-made column sets (presets at the top of the Columns window):
| Preset | For |
|---|---|
| Best | A general overview: visitors, clicks, conversions, cost, revenue, profit, ROI, CR, EPC, CPC, CPA |
| Finance | Money: revenue by status, profit, ROI confirmed vs all |
| COD | Cash-on-delivery offers: leads, sales, approve %, rejected, trash, CPL, CPS |
| Lander to Offer | Landing performance: LP views, LP clicks, LP CTR, time on page, bounce, scroll, PWA installs |
| Traffic | Traffic quality: uniques, bots, possible bots, proxies, empty referrers |
| Metric | What it counts |
|---|---|
| Clicks | Every visit to the campaign link, whatever stream served it — the same as Keitaro. Offer transitions are counted separately (LP clicks, Real offer clicks) |
| Visitors | All hits on the campaign URL — equals Clicks; the denominator of CPV and EPV |
| Unique clicks (campaign) / uClicks | Visitors counted once per campaign (by IP, IP + User-Agent or cookie — the campaign's uniqueness setting) within the uniqueness period |
| Unique clicks (flow) | Counted once per stream — a visitor who hits two streams counts in each |
| Unique clicks (global) | Counted once across all campaigns of the tracker |
| Unique clicks % | Unique clicks ÷ Clicks |
| Bots | Hits whose User-Agent looks like a crawler or a tool (the same signatures cloaking uses). Included in Visitors |
| Bot % | Bots ÷ Clicks |
| Possible bots | Visits where the landing timer ran but not a single mouse move or touch happened — a hint, not a verdict |
| Proxies | Hits from proxy / VPN / Tor IPs. Needs the IP2Proxy database |
| Empty referrers | Hits without a referrer: typed in, in-app browsers, or a source that strips it |
| Metric | What it counts |
|---|---|
| Conversions | Every conversion that arrived by postback, any status |
| Leads | Conversions in lead (hold, pending) status |
| Sales | Approved conversions (sale) |
| Rejected | Rejected by the advertiser |
| Trash | Invalid leads (fake phone, duplicate…) |
| Registrations, Deposits | Conversions of the registration / deposit types (gambling, betting, finance) |
| Approve % | Sales ÷ (leads + sales + rejected + trash) — the share of leads the advertiser paid for |
| CR | Conversions ÷ Clicks × 100% |
| CR (sales / deposits / hold / registrations) | The same, counting only that status |
| CR (regs to deps) | Deposits ÷ Registrations |
| uCR | Registrations ÷ Unique clicks |
Which statuses count as a "conversion", "sale" or "profit" is set in ⚙ → Settings → Conversion Types.
| Metric | Formula |
|---|---|
| Cost | What the traffic cost: from the campaign's cost model (CPC, CPM…) or from cost import (Facebook, TikTok, Google, push networks) |
| Spend (cabinet) | Cost without the agency fee |
| Agency fee | The fee added on top of the platform spend, if an agency is configured |
| Revenue | The sum of payouts of all conversions |
| Revenue (confirmed / hold / rejected / trash / registration / deposit) | Revenue of conversions in that status |
| Profit/Loss (all) | Revenue − Cost |
| Profit/Loss (confirmed) | Confirmed revenue − Cost |
| ROI (all) | Profit ÷ Cost × 100%. +50% means every $1 spent came back as $1.50 |
| ROI (confirmed) | The same, only with approved money — the honest number for offers with holds |
| Margin | Profit ÷ Revenue × 100% — what share of the revenue you keep |
| Metric | Formula | Answers |
|---|---|---|
| EPC — earnings per click | Revenue ÷ Clicks | How much one click earns. Compare with CPC: EPC > CPC means profit |
| uEPC | Revenue ÷ Unique clicks | The same per unique visitor |
| EPC (hold / registration / confirmed) | That revenue ÷ Clicks | — |
| EPV — earnings per visit | Revenue ÷ Visitors | Equals EPC now that every visit is a click |
| CPC — cost per click | Cost ÷ Clicks | — |
| uCPC | Cost ÷ Unique clicks | — |
| CPV — cost per visit | Cost ÷ Visitors | Equals CPC |
| eCPC | Cost ÷ Clicks | The same as CPC, kept for Keitaro habits |
| CPA — cost per action | Cost ÷ Conversions | What one conversion costs you |
| CPL / CPS / CPR / CPD | Cost ÷ Leads / Sales / Registrations / Deposits | — |
| EC — earnings per conversion | Revenue ÷ Conversions | The average payout |
| EC (confirmed) | Confirmed revenue ÷ Sales | — |
| eCPM | Profit ÷ Clicks × 1000 | Profit per thousand clicks |
Filled only when cost import from an ad platform is connected:
| Metric | Formula |
|---|---|
| Impressions | Ad impressions reported by the platform |
| Clicks (platform) | Link clicks reported by the platform |
| CPM (platform) | Cost ÷ Impressions × 1000 |
| CTR (platform) | Platform clicks ÷ Impressions |
| Click loss | 1 − Visitors ÷ Platform clicks — clicks the platform charged for that never reached the tracker (slow page, in-app browser, bots) |
| Metric | Formula |
|---|---|
| LP Views | Landing impressions |
| LP Clicks | Visitors who pressed the button and actually left to the offer |
| LP CTR | LP Clicks ÷ LP Views × 100% |
| Real LP clicks, Real LP CTR, Real offer clicks | The same honest funnel under the names older column layouts used; Real offer clicks = direct offer clicks + landing transitions |
| Time since LP click (LP time) | Average time from opening the landing to pressing the button |
| Time on LP | Average time on the landing for every visitor, including those who never clicked. Only visible time counts |
| LP bounce rate | Share of measured visits shorter than 5 seconds |
| LP scroll depth | Average deepest scroll, 0–100% |
| LP measured visits | How many visits reported a time — the sample behind the three metrics above |
| Metric | Formula |
|---|---|
| PWA install intents | Taps on the PWA's Install button |
| PWA installs / Real PWA installs | Install events; real excludes bots |
| PWA opens | Re-opens of the installed app from the home screen |
| PWA install rate | Real installs ÷ Clicks |
| PWA screen views | Views of the PWA funnel screens |
| Push subscribers | Clicks whose visitor allowed notifications |
| Popup shown / clicks / closed / conversions, Popup CTR | The conversion popup funnel; CTR = popup clicks ÷ popup shown. See Conversion popups |
- Is the campaign profitable? ROI (confirmed). Positive — yes.
- Is the problem the traffic or the offer? CR low and CPC normal → the offer or the landing; CR fine but CPC high → the traffic is too expensive.
- Is the landing helping? Compare LP CTR and CR of Landing + Offer streams against a Direct stream.
- Is the network cutting leads? Approve % falling while Leads stay the same.
- Are you paying for bots? Bot %, Possible bots, Click loss.
Custom formulas: ⚙ → Settings → Custom Metrics. Reference: Reports, logs and metrics.