Repository navigation

v2 is a rewrite of the whole stack. v1 could no longer be built after Ookla shut down its Bintray repository, and its runner stopped testing after the first network hiccup. v2 is smaller, keeps running through errors, records much more per test, and runs on current InfluxDB and Grafana.
Highlights
- Reliable runner. A failed, hanging or unreachable test is logged and skipped, and the next run happens on schedule. If InfluxDB is temporarily down, writes are retried. No more silent stops after a few weeks (#21, #8).
- More data per test. Each test is one
speedtestpoint with download, upload, ping, jitter, latency under load, packet loss, bytes, server, ISP and a link to the result on speedtest.net (#13, #30). - Scheduling. A fixed interval as before, or a cron schedule with your time zone (
SPEEDTEST_CRON,TZ) (#35). - Several servers.
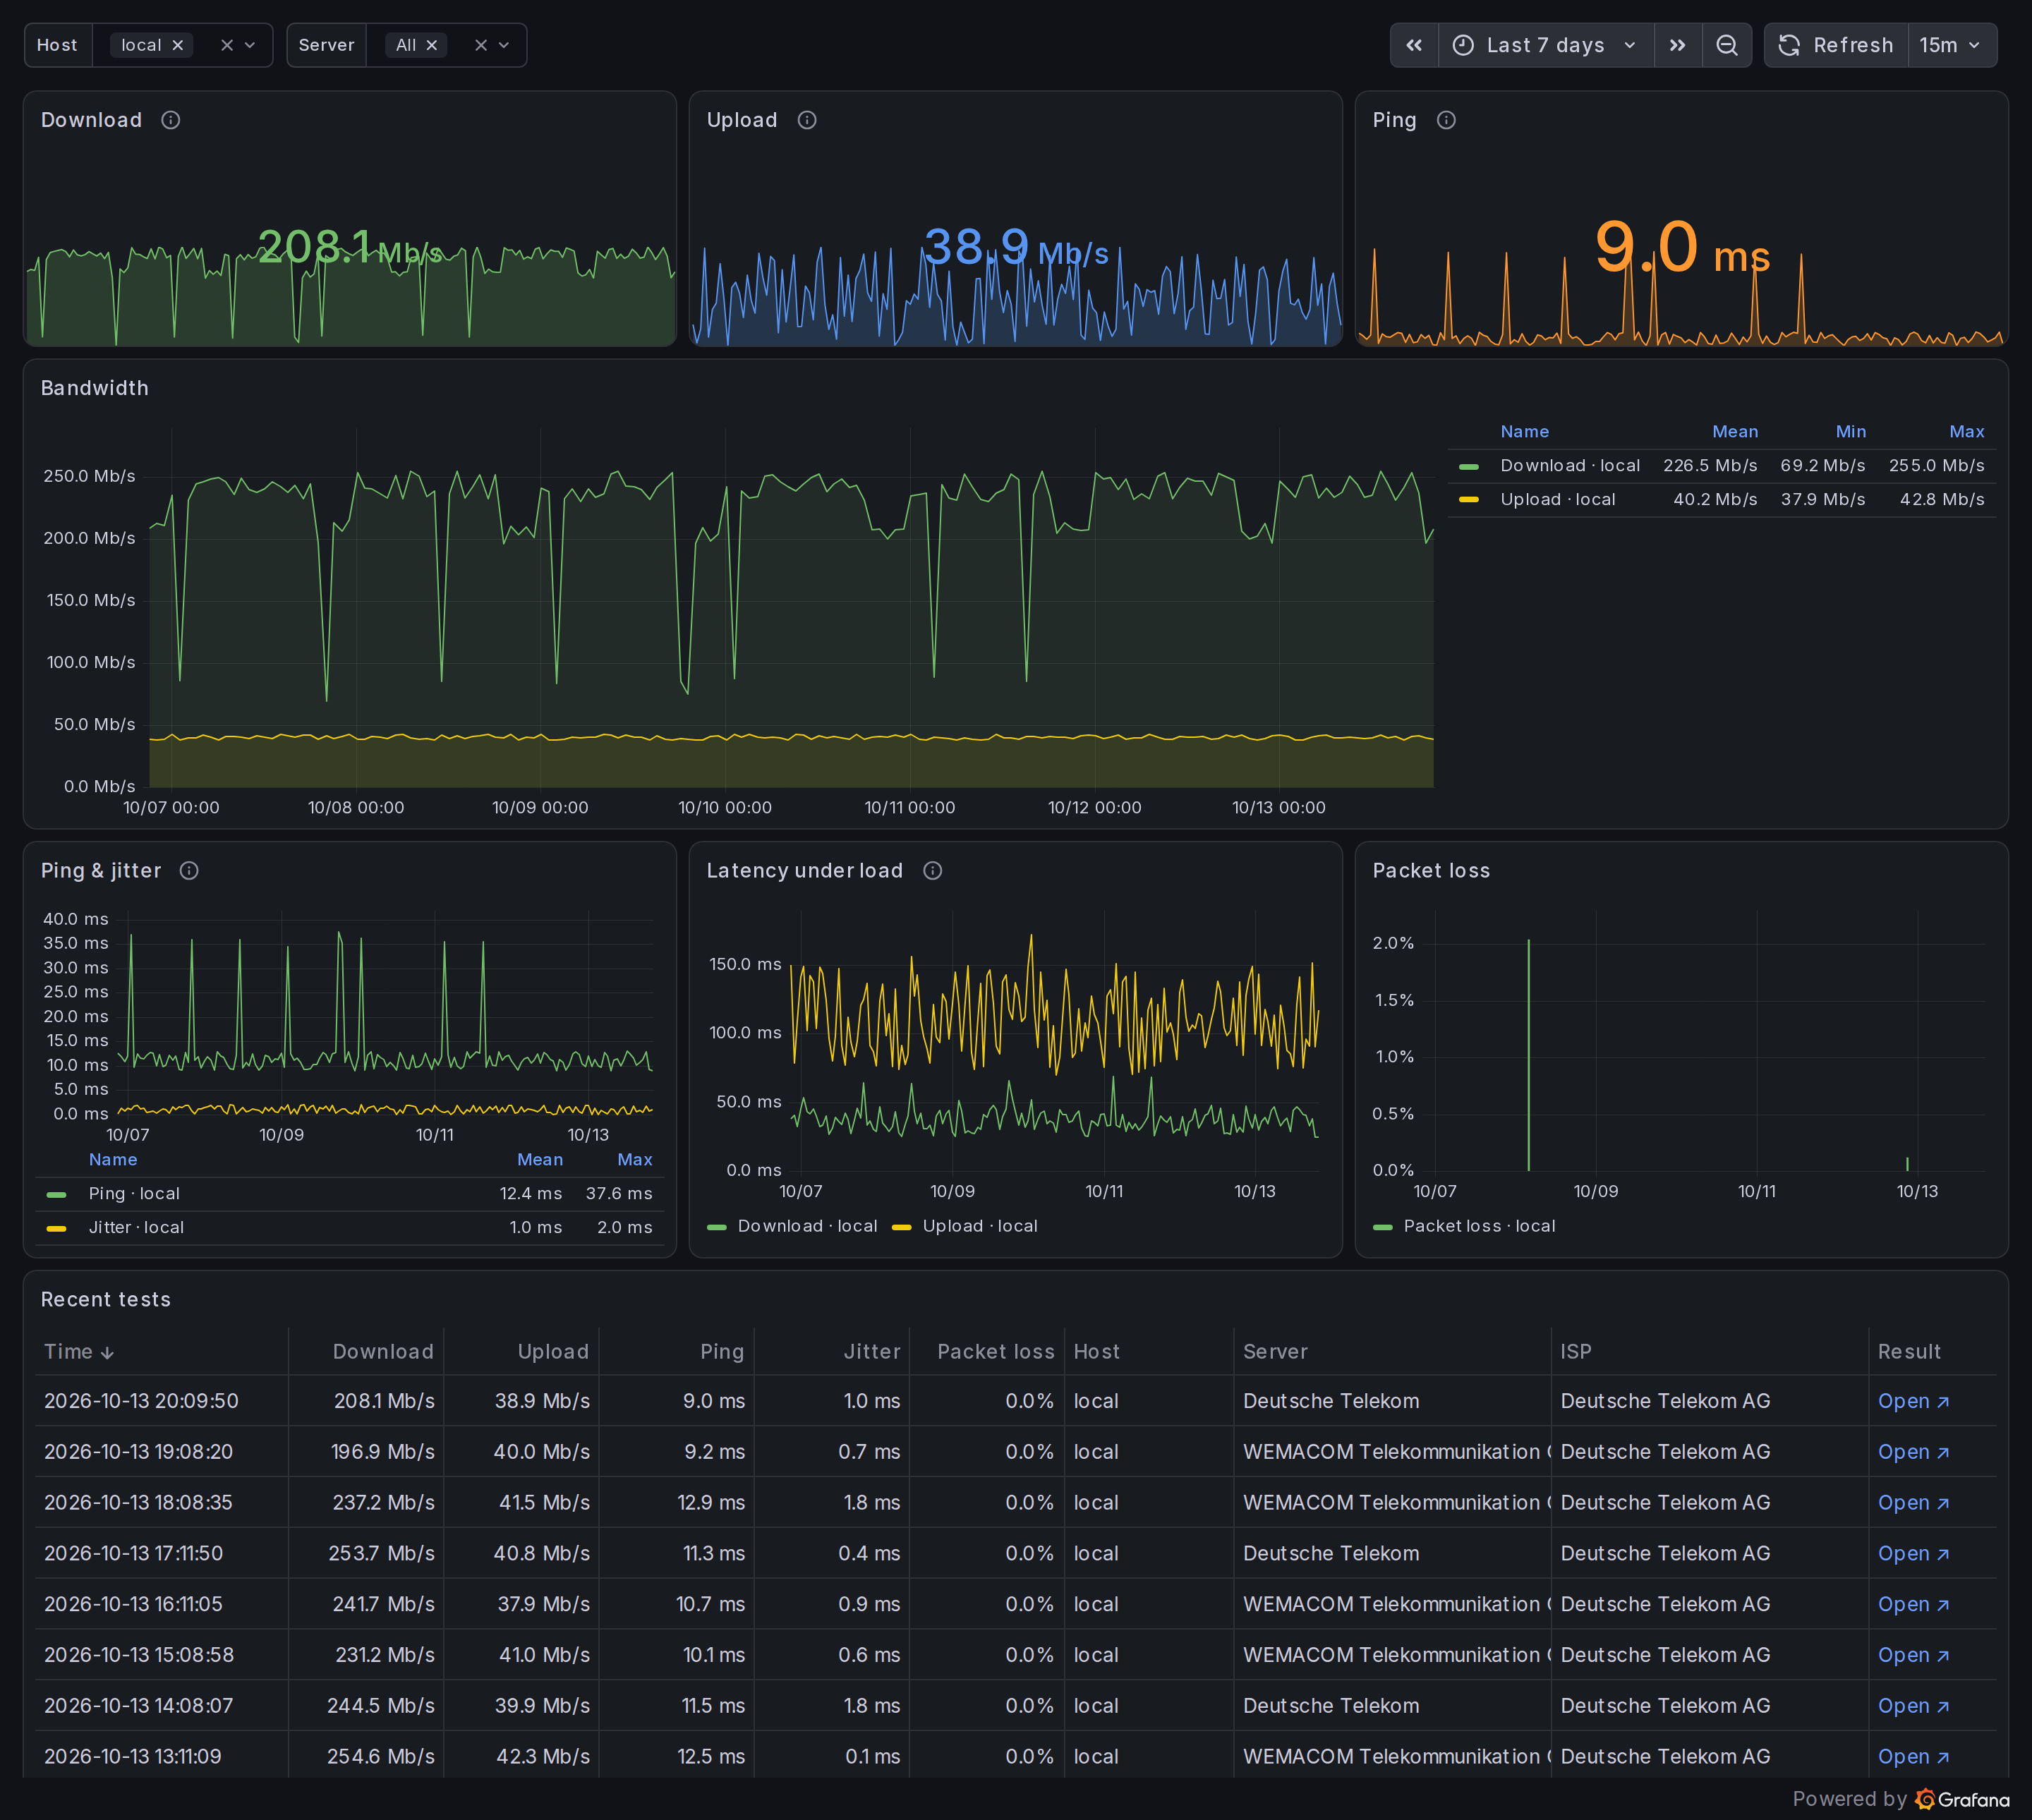
SPEEDTEST_SERVER=id1,id2tests them one after another, never in parallel (#12). - New dashboard. Host and Server filters; latest values with trends; bandwidth; ping & jitter; latency under load; packet loss; and a table of recent tests.
- Current stack. InfluxDB 1.12.4 and Grafana 13.2.3, pinned. InfluxDB has authentication enabled and isn't reachable from outside the stack. Grafana requires a login by default.
- Small image. Alpine, a shell script,
jqandcurl; 13–18 MB instead of a Node.js app. The Ookla CLI 1.2.0 is checked against pinned checksums. - Images on Docker Hub and GitHub.
frdmn/speedtest-grafanaandghcr.io/frdmn/speedtest-grafanafor amd64, arm64 and armv7. - Documentation. New README with all settings, the data schema, example queries, a setup for several locations, and how to use an existing InfluxDB/Grafana (#16, #17, #26, #36, #41).
Breaking changes
- New data format. One
speedtestmeasurement replaces the separatedownload,uploadandpingmeasurements. Custom dashboards and queries need updating. - New configuration. Start from the new
.env.sample.GRAFANA_ADMIN_PASSWORDandINFLUXDB_PASSWORDare required;SPEEDTEST_SPEEDTEST_INTERVALis nowSPEEDTEST_INTERVAL(#14). - Docker volumes instead of
./data. The bundled stack no longer uses./data/influxdb. - 64-bit host required for the bundled stack, since InfluxDB 1.12 has no 32-bit images. The runner image still runs on armv7 and can write to an InfluxDB elsewhere.
- InfluxDB port no longer published. See "Several locations" in the README if you run remote runners.
Upgrading from v1
Your history can be imported. Follow Upgrading from v1 in the README: stop v1, git pull, create .env, start v2, then run one command that imports ./data/influxdb into the new format. The old data is only read, never changed.
To stay on v1, pin the image to frdmn/speedtest-grafana:1.
Thanks
Several ideas in this release come from your issues and pull requests:
- @iamk3 for #29: the first fix for the Bintray shutdown, and jitter in the dashboard
- @n1nj4888 for #13 and #15: a single measurement with all of Ookla's fields
- @anuragbhatia for #11 and #12:
SPEEDTEST_SERVERand testing several servers - @mmaxbar for tracking down the hanging test in #21 and proposing the timeout
- @IMPranshu for #33: the
SPEEDTEST_INTERVALfix - @crazyuploader (#18) and @YouriT (#20), whose merged fixes ship to
masterwith this release
…and everyone who reported issues and shared logs over the years.
Contributors


anuragbhatia, YouriT, and 5 other contributors