Repository navigation
QSOs and Score
Hello Contest provides several different views of the worked QSOs and the current scoring information.
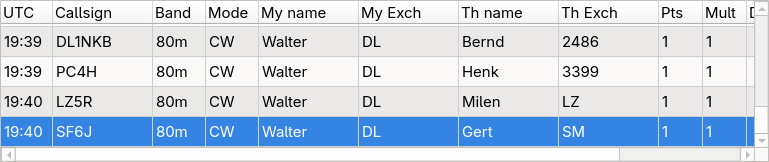
The QSOs table shows all worked QSOs, sorted by time.
You can edit a QSO by clicking onto the corresponding list item. The QSO data will be filled into the data entry fields. Modify it to your liking and press the Log button to save the changes.
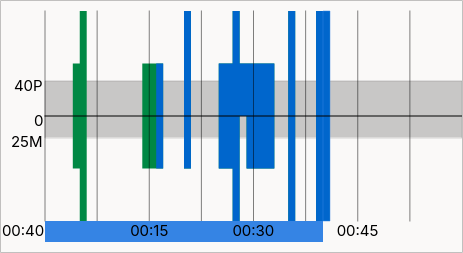
The Score Graph shows the full timespan of the contest, divided into time frames, also called "bins" (example: in a 24h contest, each bin represents 15 minutes of the contest). The black zero line goes marks the center of the Score Graph. The number of points per bin are visualized by a rectangle drawn upwards from the zero line, the number of multis per block is represented by a rectangle drawn downwards from the zero line.
The gray area around the zero line marks the goals you set for the points and multis per hour in the contest settings. If the rectangle of a block is within this gray area, you did not reach your goal in the corresponding time frame in the contest.
The rectangles are color coded to indicate the used band. If there were multiple bands used in one time frame, the corresponding rectangles are stacked vertically within the boundaries of the bin.
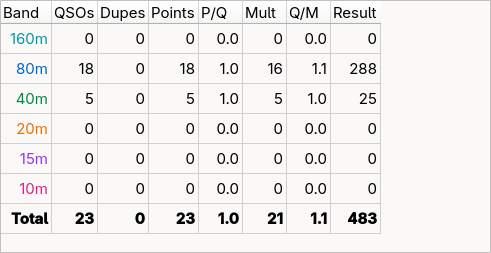
The Score Table lists the points and multis per band and also the score in total. In addition, the points per QSO (P/Q) and QSOs per multi (Q/M) are also shown for each table row. The band names are color coded corresponding to the Score Graph.
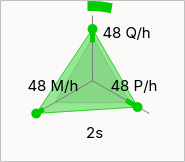
The QSO Rate view visualizes your current performance to see all important parameters at a glance.
On three axes it shows the per hour rates of QSOs, points, and multis. For each rate there is one indicator for the value extrapolated over the last 5 minutes (the dot) and the actual value for the last 60 minutes (the end of the colored line). Those indicators are color coded: green means the rate is above the goal, the closer to red, the further the rate is below the goal. A gray triangle in the center marks the goals on the three axes.
The number on the six o'clock position shows the time elapsed since the last logged QSO. A colored circle segment on the outline also visualizes the elapsed time. The full circle represents the time to keep the QSO rate goal. As long as the circle is open, you are faster than your set goal for the QSO rate.