runtime/pprof: give more useful profiling output for time.Now (and other vDSO functions) on Linux #24142
Description
(Moving this over from a discussion at https://groups.google.com/d/msg/golang-nuts/83xaAgzL2cU/OcLIOdi8CwAJ.)
These results are on Go 1.10 / Linux / amd64, but they're unchanged from previous versions.
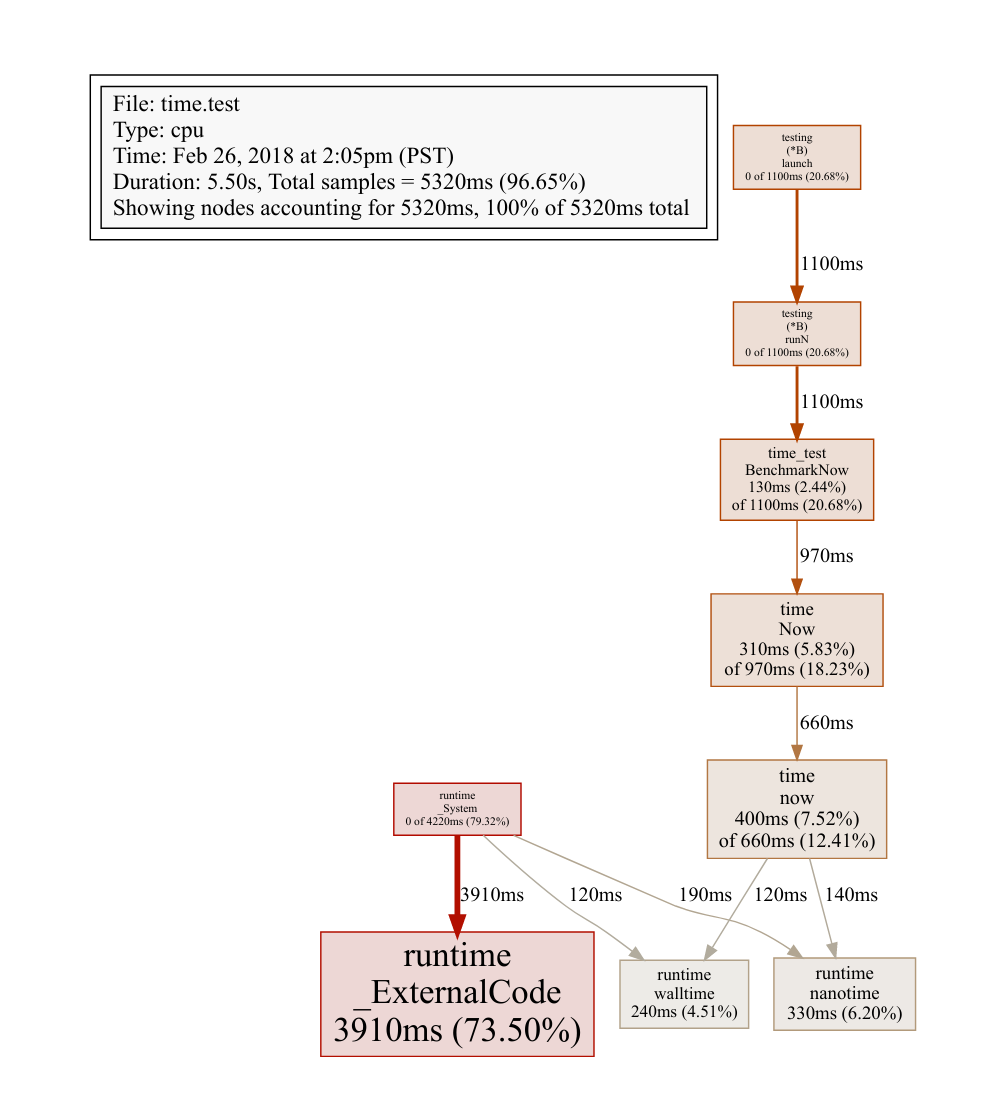
On Linux, time.Now (and anything else which calls runtime.walltime and runtime.nanotime) are implemented using a vDSO. When a profiling signal arrives during the vDSO call, pprof attributes that time to the catch-all runtime._ExternalCode, unrelated to any Go function.
Here's a demonstration:
go test -run xxx -bench '^BenchmarkNow$' -benchtime 5s -cpuprofile time.prof time
(pprof) top10
Showing nodes accounting for 5320ms, 100% of 5320ms total
      flat  flat%   sum%        cum   cum%
    3910ms 73.50% 73.50%     3910ms 73.50%  runtime._ExternalCode
     400ms  7.52% 81.02%      660ms 12.41%  time.now
     330ms  6.20% 87.22%      330ms  6.20%  runtime.nanotime
     310ms  5.83% 93.05%      970ms 18.23%  time.Now
     240ms  4.51% 97.56%      240ms  4.51%  runtime.walltime
     130ms  2.44%   100%     1100ms 20.68%  time_test.BenchmarkNow
         0     0%   100%     4220ms 79.32%  runtime._System
         0     0%   100%     1100ms 20.68%  testing.(*B).launch
         0     0%   100%     1100ms 20.68%  testing.(*B).runN
This is unhelpful for the user in several ways:
- This time is counted in the same bucket as any other external code (such as cgo). Most users will not expect that runtime._ExternalCode is due to a core standard library function like time.Now.
- It doesn't actually tell the user what part of the Go code is the source of the time.Now calls.
@ianlancetaylor kindly cooked up https://golang.org/cl/97315 to address (1), so that at least this will be marked as _VDSO instead of _ExternalCode.
Even with this change, it's still hard for users to know that the VDSO time is (likely, but not necessarily) due to time.Now calls, or where those calls originate.
By contrast, if I have a program which is slow because it's making many os.Stat calls, it will be clear from the profile graph that the cause is os.Stat (and what function is calling os.Stat), even though the big red box with all the self time is labeled syscall.Syscall.
I don't know how this would be implemented or even if it's feasible, but I hope that something better can be done for these vDSO calls as well.
This is not a hypothetical or benchmark-only problem. Here is a small part of a pprof graph from an important production service that I'm trying to debug:

(This is a CGO_ENABLED=0 build.)