cmd/pprof: macOS 12.6.1 profile overcounts system calls (again) #57722
Description
What version of Go are you using (go version)?
$ go version
go version go1.19.4 darwin/arm64
This is on macOS 12.6.1 with an M1 chip, but the problem seems to affect Intel as well.
Does this issue reproduce with the latest release?
Yes.
What operating system and processor architecture are you using (go env)?
go env Output
$ go env
GO111MODULE="auto"
GOARCH="arm64"
GOBIN=""
GOCACHE="/Users/MyUser/Library/Caches/go-build"
GOENV="/Users/MyUser/Library/Application Support/go/env"
GOEXE=""
GOEXPERIMENT=""
GOFLAGS="-count=1"
GOHOSTARCH="arm64"
GOHOSTOS="darwin"
GOINSECURE=""
GOMODCACHE="/Users/MyUser/go/pkg/mod"
GONOPROXY="github.com/MyOrg"
GONOSUMDB="github.com/MyOrg,go.myorg.io"
GOOS="darwin"
GOPATH="/Users/MyUser/go"
GOPRIVATE="github.com/MyOrg"
GOPROXY="binaries.myorg.io,https://proxy.golang.org,direct"
GOROOT="/opt/homebrew/Cellar/go/1.19.4/libexec"
GOSUMDB="sum.golang.org"
GOTMPDIR=""
GOTOOLDIR="/opt/homebrew/Cellar/go/1.19.4/libexec/pkg/tool/darwin_arm64"
GOVCS=""
GOVERSION="go1.19.4"
GCCGO="gccgo"
AR="ar"
CC="clang"
CXX="clang++"
CGO_ENABLED="1"
GOMOD="/Users/MyUser/go/src/github.com/felixge/macos-profiler-bias/go.mod"
GOWORK=""
CGO_CFLAGS="-g -O2"
CGO_CPPFLAGS=""
CGO_CXXFLAGS="-g -O2"
CGO_FFLAGS="-g -O2"
CGO_LDFLAGS="-g -O2"
PKG_CONFIG="pkg-config"
GOGCCFLAGS="-fPIC -arch arm64 -pthread -fno-caret-diagnostics -Qunused-arguments -fmessage-length=0 -fdebug-prefix-map=/var/folders/0t/nwrdnfnd2mjdgr0z_p_f6xww0000gq/T/go-build3012663781=/tmp/go-build -gno-record-gcc-switches -fno-common"
What did you do?
Create a CPU profile of a CPU-bound workload that is interleaved with short system calls.
For example TestInterleavedIO is a reproducer that is compressing a 250MB file containing random data.
What did you expect to see?
A profile that is similar to the one shown below for linux. Most of time should be spent on gzip compression, and a little bit on syscalls.

What did you see instead?
On macOS the majority of time is attributed to read and write syscalls. The gzip compression is barely showing up at all.

Sanity Check
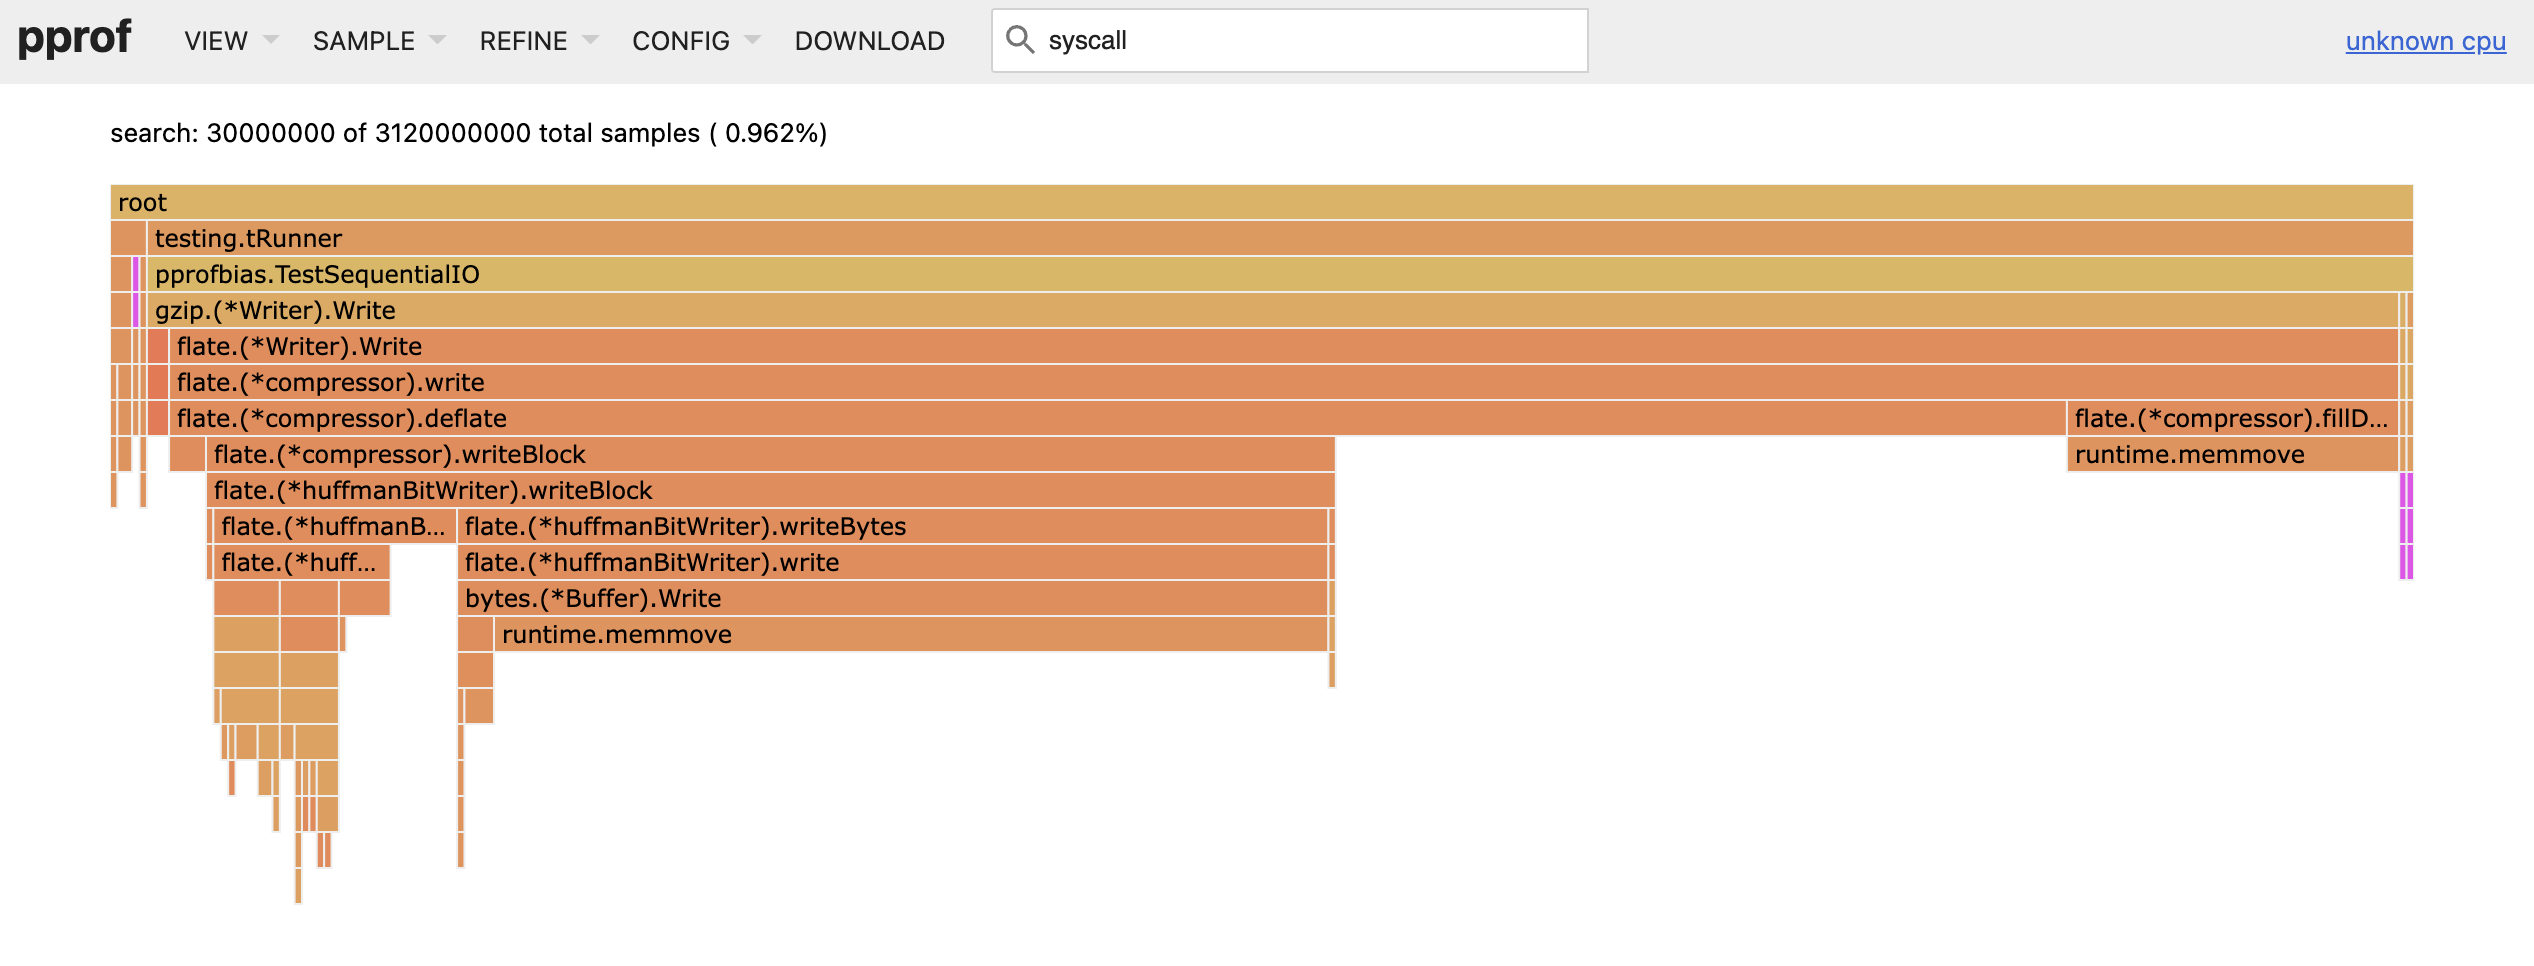
TestSequentialIO implements the same workload, but instead of interleaved I/O, it does one big read first, followed by gzip compression, followed by a big write.
As expected, Linux produces a profile dominated by gzip compression.

And macOS now shows the right profile too.
Conclusion
macOS setitimer(2) seems to bias towards syscalls. This issue was reported and fixed in the past, see #17406 (2016) and #6047 (2013). So this could be a macOS regression.
I've uploaded all code, pprofs and screenshots to this google drive folder.
Metadata
Metadata
Assignees
Labels
Type
Projects
Status