Possible problem with geom_density() with after_stat('count') #550
Description
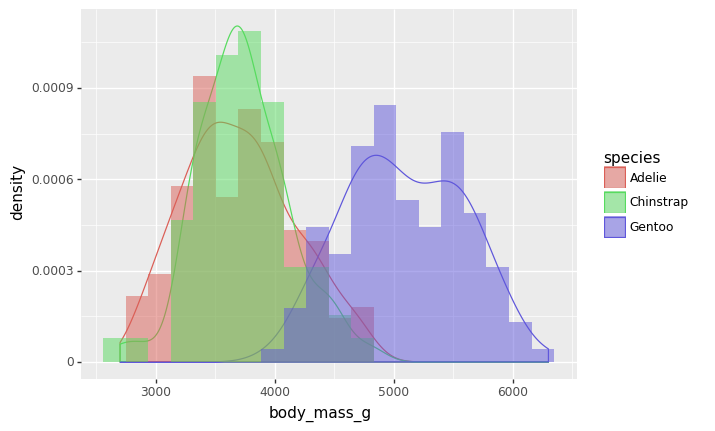
This code works as expected (density histogram with kde)
from plotnine import *
import pandas as pd

p_df = pd.read_csv('https://raw.githubusercontent.com/mwaskom/seaborn-data/master/penguins.csv')

(
    ggplot(p_df.dropna(), aes(x='body_mass_g', y=after_stat('density')))
    + geom_density(aes(color='species'), alpha=0.8)
    + geom_histogram(aes(fill='species'), bins=20, alpha=0.5, position='identity')
)
But switching from after_stat('density') to after_stat('count') doesn't.
from plotnine import *
import pandas as pd

p_df = pd.read_csv('https://raw.githubusercontent.com/mwaskom/seaborn-data/master/penguins.csv')

(
    ggplot(p_df.dropna(), aes(x='body_mass_g', y=after_stat('count')))
    + geom_density(aes(color='species'), alpha=0.8)
    + geom_histogram(aes(fill='species'), bins=20, alpha=0.5, position='identity')
)

The problem might be related to geom_density "ignoring" that count should be used instead of density. Same code as before with one histogram commented out.
from plotnine import *
import pandas as pd

p_df = pd.read_csv('https://raw.githubusercontent.com/mwaskom/seaborn-data/master/penguins.csv')

(
    ggplot(p_df.dropna(), aes(x='body_mass_g', y=after_stat('count')))
    + geom_density(aes(color='species'), alpha=0.8)
    # + geom_histogram(aes(fill='species'), bins=20, alpha=0.5, position='identity')
)
