Repository navigation
pymatchit-causal: Propensity Matching for Python based on the R MatchIt package.

Summary
pymatchit is a Python library designed to preprocess observational data for causal inference by balancing covariates between treated and control groups. It implements Propensity Score Matching (PSM) and other matching techniques to reduce selection bias, mirroring the workflow of the widely standard R package MatchIt [MatchIt:2011]. The library provides a familiar formula-based API (e.g., treat ~ age + educ) while leveraging the speed and ecosystem of Python's scikit-learn and pandas. The package is distributed via PyPI as pymatchit-causal.
Statement of Need
In observational studies, estimating the causal effect of a treatment (e.g., a job training program) on an outcome (e.g., wages) is challenging because treated subjects often differ systematically from control subjects. Propensity Score Matching is a common technique to address this by constructing a "synthetic" control group that statistically resembles the treated group [Rosenbaum:1983].
While R users have long relied on MatchIt for this task, the Python ecosystem has lacked a dedicated, unified library for matching that offers:
- R-style Formula Syntax: Allowing users to define causal relationships clearly and concisely.
- Diverse Distance Metrics: Beyond simple logistic regression,
pymatchitsupports modern machine learning estimators (Random Forest, Gradient Boosting, Neural Networks) viascikit-learnfor robust propensity score estimation. - Standardized Diagnostics: Generating "Love plots" (standardized mean difference plots) and Empirical Cumulative Distribution Function (ECDF) plots is critical for verifying balance but often requires writing extensive custom boilerplate code in Python.
pymatchit fills this gap, enabling data scientists to perform rigorous causal matching and balance assessment entirely within the Python environment without needing to switch languages.
Functionality
The package is designed around a three-step workflow that separates design (matching) from analysis:
-
Estimation & Matching: Users initialize a
MatchItobject and fit a model using R-style formulas. The library calculates propensity scores and matches units using algorithms like Nearest Neighbor.from pymatchit import MatchIt, load_lalonde # Load the standard Lalonde dataset df = load_lalonde() # Match using Nearest Neighbor with a Caliper # We use Logistic Regression (GLM) for the propensity score m = MatchIt(df, method='nearest', distance='glm', caliper=0.2) m.fit("treat ~ age + educ + race + married + nodegree + re74 + re75")
-
Diagnostics: Users can immediately visualize covariate balance to ensure the matching procedure was successful.
# Generate Love Plot to check Standardized Mean Differences (SMD)
m.plot(type='balance')

# Check distributional balance using ECDF plots
m.plot(type='ecdf', variable='age')
-
Analysis: The matched dataset (with weights) can be extracted for downstream analysis.
# Return the matched dataset with a 'weights' column
matched_data = m.matched_data
The package currently supports Nearest Neighbor, Exact, and Subclassification matching, utilizing the scikit-learn ecosystem for underlying distance estimation.
Validation against R MatchIt
To ensure reliability, pymatchit was validated against the original R MatchIt package using the standard LaLonde dataset [Lalonde:1986]. We performed a nearest-neighbor match (ratio=1, caliper=0.2) using logistic regression for propensity score estimation in both languages.
As shown in Figure 1, the covariate balance results—measured by Standardized Mean Differences (SMD)—are nearly identical. Both implementations successfully reduced the imbalance (red circles) to below 0.1 standard deviations (blue circles) for most covariates.
Covariate Balance Comparison: Python (pymatchit) vs R (MatchIt). The reduction in Standardized Mean Difference is consistent across both implementations.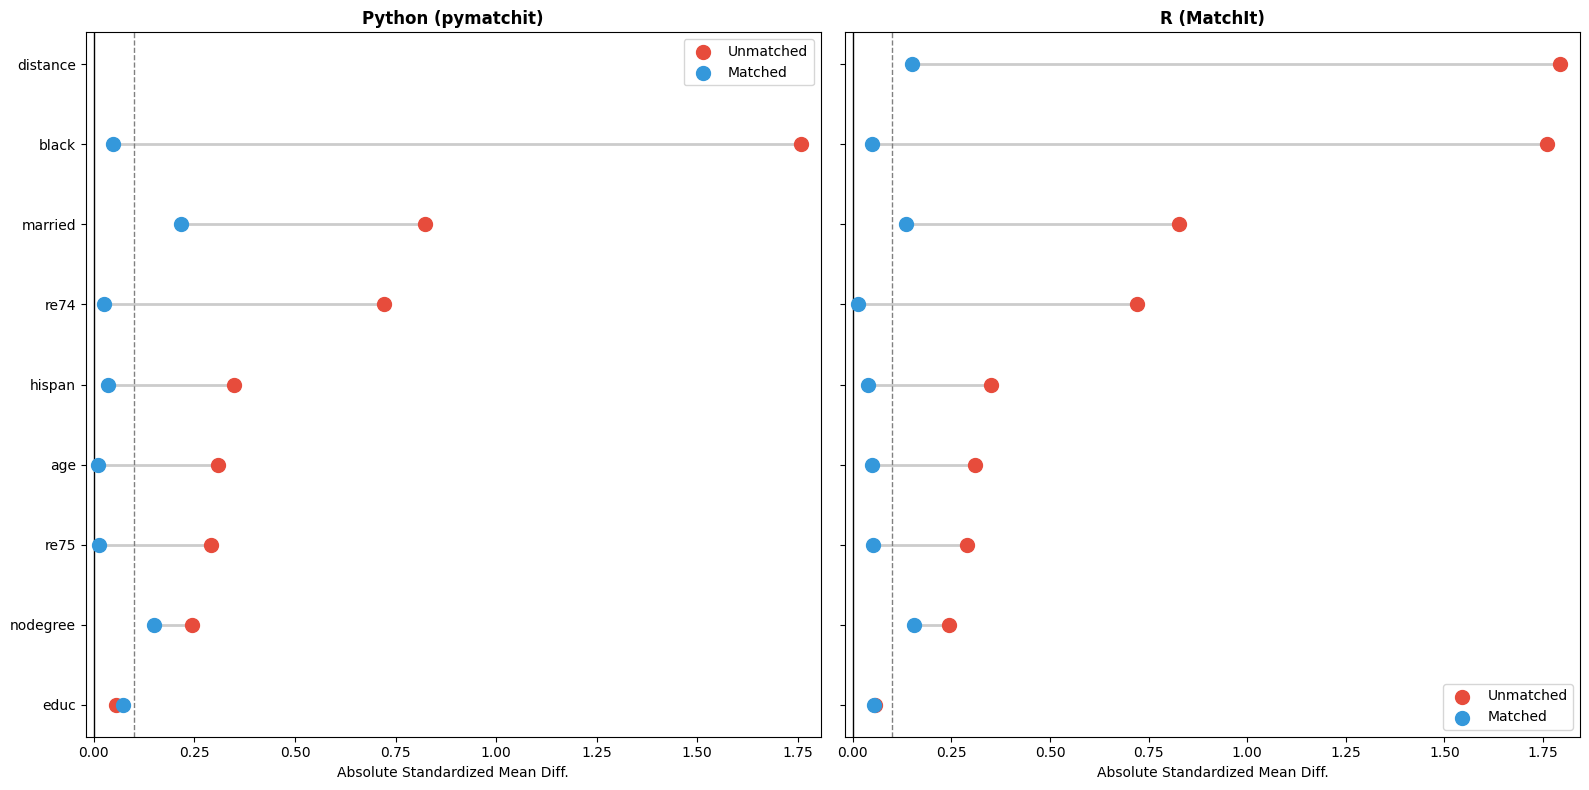
We further analyzed the specific units selected by the greedy matching algorithm (Figure 2). While there is substantial overlap (Green Xs, 89 units), there are minor discrepancies in unit selection (Orange circles vs. Blue crosses).
Unit Selection Comparison. Discrepancies occur due to floating-point precision differences in Propensity Score estimation between Python's statsmodels and R's glm.
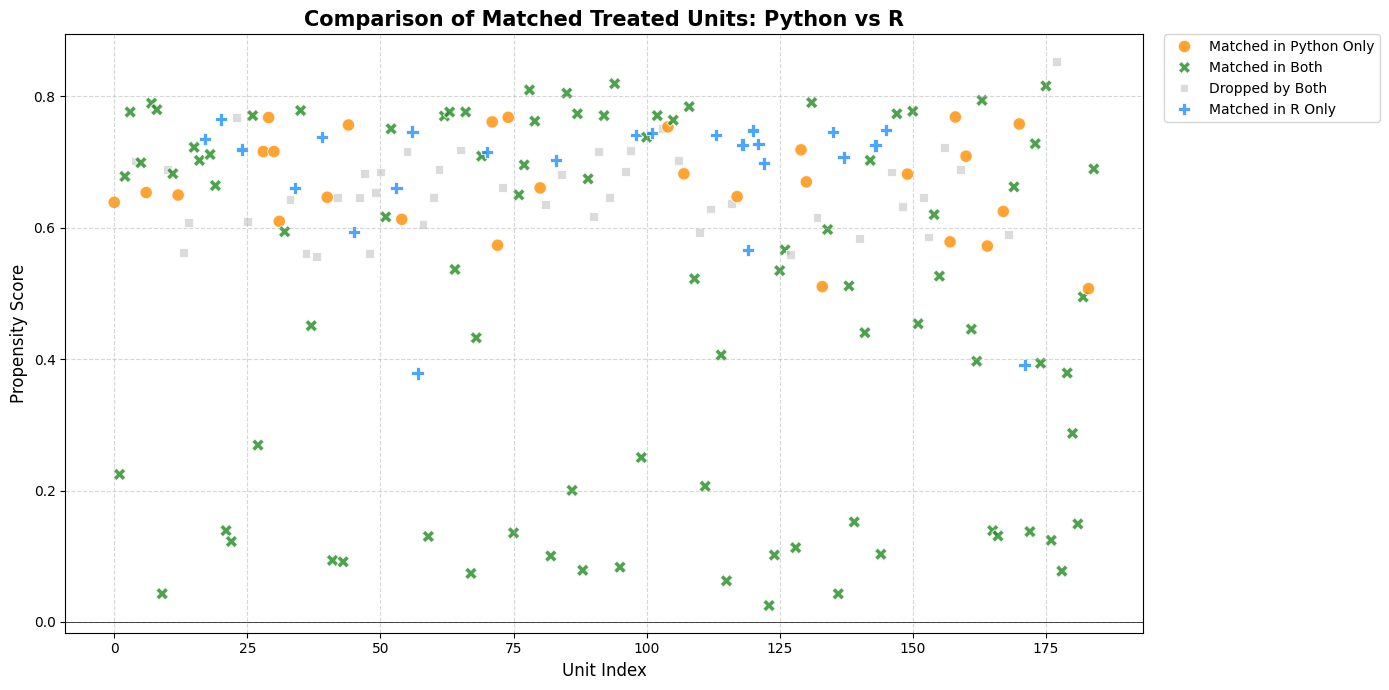
These discrepancies are expected and stem from minor floating-point differences between Python's statsmodels (used by pymatchit) and R's glm engine. In greedy nearest-neighbor matching, even a pymatchit remains statistically equivalent to the R reference implementation.
Acknowledgements
This project builds upon the methodological foundations laid by the authors of the R MatchIt package: Daniel Ho, Kosuke Imai, Gary King, and Elizabeth Stuart.
If you use the package please cite:
Jonas Tünnermann
