For our final project, we dove into the fascinating world of Boardgames! Even with digital technology, people still like to gather in a room and interact while sharing an imaginative experience together. As one team member pointed out, even in an apocalyptic universe, people would still gather to play these types of games. With one content expert on the team, and the rest of us being novices, we wondered if there were clusters of games – and about the possibility of making useful recommendations in an interactive dashboard. After our analysis of our boardgame dataset we eventually created a visual landscape of boardgames that can be explored by those eager to find new games and others who want to see how their favorites may measure up to other games. 👍
The following are some examples of the questions we asked prior to our analysis as well as a few we found ourselves asking after our analysis.
- What genre do people tend to enjoy the most?
- Which year released the most top-rated board games?
- Which boardgame mechanic is the most popular?
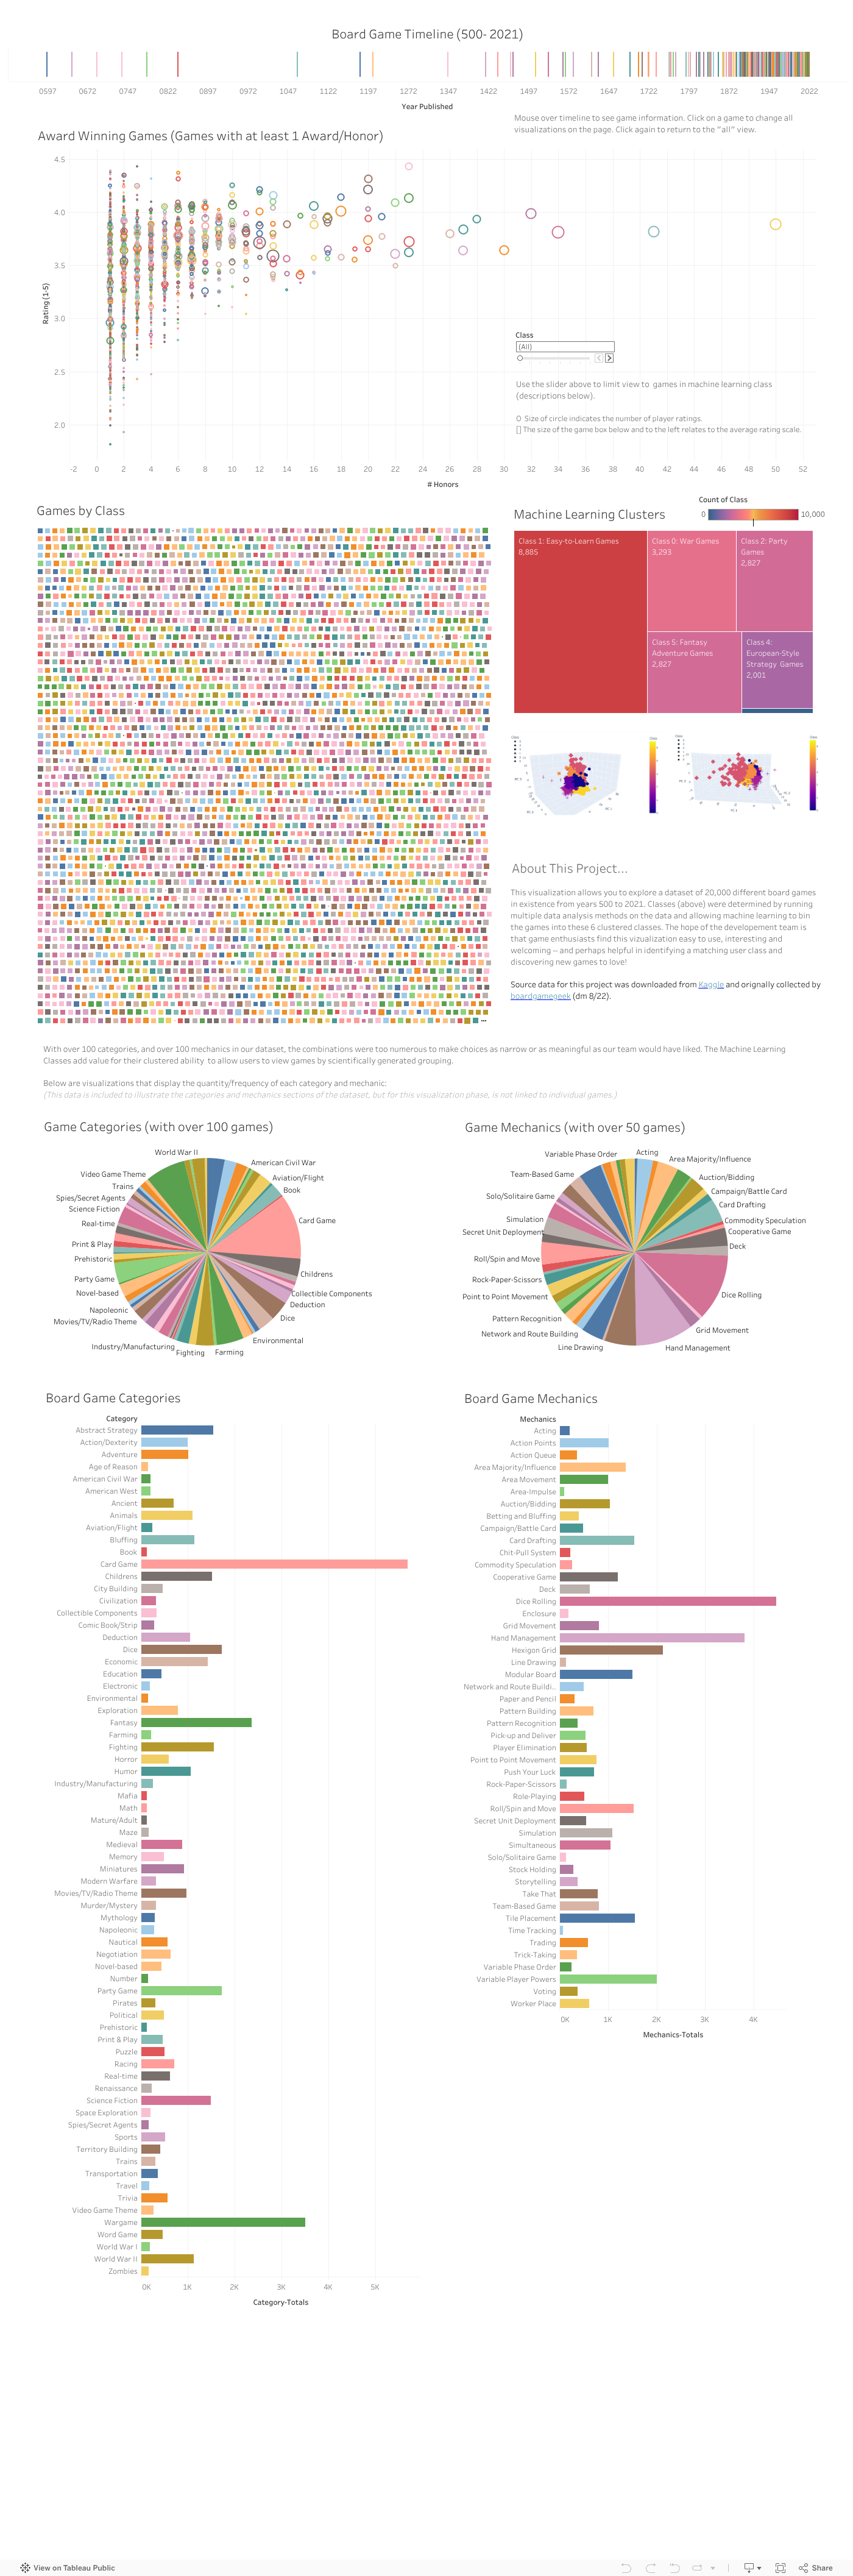
- After applying machine learning to categorize games, how do these algin with current genre/categorical classifications already assigned?
- How does unsupervised machine learning categorize games vs the pre-existing genre/label assigned?
🤔 The big question, however, was,
- Can we recommend board games to the users based on boardgame characteristics and create an interactive recommender?
For the data we chose to use for our project, we collected source data that came from boardgamegeek and Kaggle. The databases of board games are vast with their descriptions, rules, requirements for play, time to play, number of players, etc. A more in-depth description can be found in our r&d folder under DataDescription. You can find our original sourced and cleaned databases in our resources-1 folder titled bgg_dataset.
After cleaning data in Excel, data was analyzed in using unsupervised machine learning in Python’s Jupyter Notebook, R & R Studio, and PostgreSQL in PG Admin 4. We then used the final dataset in Tableau to create our dashboard and interactive visualizations of all we had discovered. You can find a description of our dshboard within this README, as well as visiting it here
Our final presentation on Google Slides can be found here. This is our practice video of our presentation - video
After running our machine learning model, we found that it categorized the games in a way that demonstrated clear statistical trends. The hypothesis of groups/clusters 1, 3, and 4 having different weighted scores (1, then 4, then 3 in ascending order) was confirmed.
Image: 3D-Scatter with the PCA data and the clusters

We began our analysis by begining with a Multi-Linear Regression analysis in R. Then due to the large number of features in both the category and mechanics data, we used PCA to reduce these number of features. We then clustered our data using Kmeans and the elbow method to see if some of the data are grouped differently than they are currently labelled by BoardGameGeeks.
Our hypothesis was that the machine learning model will categorize games in a way different from the way humans do. Such as games with more people, longer play times, higher complexity will be clustered together by machine learning. Labels like "civilization", "building", "campaigns" may be appropriate ones to apply to such groups.
Our Machine Learning model code is within ML_connected_to_SQLdataset
The raw data was in .csv format, was opened in Excel for initial cleaning. Deleted columns that we determined were irrelevant to our analysis (sort index: the games already have an object id, min age and player age, language dependence; podcast, blog, website: these had no bearing, board game honors (with out honors drops approx 1600 games), board game artists, publishers, game creators: nearly all of these categories dropped too many values as well as create a skewed dataset.
The next transform was to clean the array of strings formatted in the raw data, Excel was functionally worthwile here with the find replace method, then further separating the metrics of mechanics and category with the 'text to columns' function. Then used Excel to replace all blank cells with na.

For R analysis, bucketed games with max players to 20+, changed min and max playtime to minutes,initially brought entire raw data into jupyter notebook to drop colomns and do a generalizations with normalizing data.


Using ggplot to show how siteviews coorelates with class and average or popular votes below:


Further cleaning and analysis had to be run in Google Colaboratory due to the size to complete elbow curves to determine KMeans cluster sizes to try.
After using KMeans and elbow curves on categories and mechanics alone, we also combined both to see if the elbow curve would show a difference using both.


Then using R as an analysis, looked into multi-linear regressions.

 We looked for significance in predicting which games would be more popular as well as, predicing if the class definitiions were statistically significant.
Based on the p-value for both predictions. The amount of time, player count, siteviews, average votes, and class are all statistically significant to which games are the highest/lowest rated.
The preliminary data preprocessing for the machine learning analysis was done by splitting the board game mechanics column into 6 columns within Excel. Then, a list of all the mechanics was generated in Jupyter Notebook using the following code:
mechanics = [] columns = ['boardgamemechanic1', 'boardgamemechanic2', 'boardgamemechanic3', 'boardgamemechanic4', 'boardgamemechanic5', 'boardgamemechanic6'] for column in columns: for mechanic in df[column]: if mechanic not in mechanics: mechanics.append(mechanic)
The dataframe was populated with a column for each mechanic and the values in the column was populated with 0s using the following code:
zeroes = [] for i in range(20000): zeroes.append(0)
for mechanic in mechanics: df[mechanic] = zeroes
newdf = df.copy()
Then, the values in the dataframe cells were populated with 1s instead of 0s for the mechanics associated with each board game using the following code:
for column in columns: rowcount = 0 for item in newdf[column]: for mechanic in mechanics: if item == mechanic: newdf.at[rowcount,mechanic] = 1 rowcount+=1
A K-Means model was used to categorize the games based on Principal Component Analysis. This allows the machine learning algorithm to categorize games in ways that a human may not think to do. The downside of this model is that the meaning of each principal component score is opaque, making the performance of the model difficult to evaluate quantitatively. You can find our machine learning first pass here.
For our sample data, as well as for our final database, we separated tables of pertinent information from cleaned data. Then we joined tables together to get the data desired for the machine learning model. The file createtables.sql in the SQL folder, has the code used to create the original five tables in the database. These tables were then joined together to create the bg_plusstats table.
Saved in the file queries.sql you will find the code for joining the tables and creating this final bg_plusstats table. Additionally, the connection string code to connect PostgreSQL to the jupyter notebook is located in the file database_connection.ipynb.

As a team, we discussed ideas for our dashboard that will be key in presenting our findings and telling our story and developed an inital outline.

Then based on our data and alaysis, we created our interactive dashboard using Tableau. You can visit our dashboard here for our visualizations, storys and interactive elements.
- Interactive elements of Tableau allows for user selection in several different visuals and tables.
- There are also sorting options for users with buttons always well as dropdown and sliding selection tools.
- We originally hoped to include an interative recommender through either a search function or multiple choice function. This is one feature we wished to include and may have managed our project differently to include this interactive feature.
Exploring the world of boardgames was an enjoyable project and analysis. We found difficulties with the chosen dataset (e.g., large number of features and erroneous letters/characters within names of games). One thing we may have done differently may have been to review and clean multiple datasets as a team before beginning our analysis. Overall, we were able to successfully create an interactive board game dashboard that can be explored. We also found that subjectively, the groups of the boardgames from our dataset align well with the general impressions our resident boardgame expert, Abe. This inspired us to reflect on the possibility of gathering more data and from the board game community that we can use for future analysis. It could be possible to compare our data collection with other datasets to be able to create the idea of a board game recommender.