Repository navigation

Logchef v2.8.0
Search Grafana Loki, count with LogchefQL, alert per service, and see who queried what.
v2.8.0 adds Grafana Loki as a third backend beside ClickHouse and VictoriaLogs. LogchefQL now aggregates, alert rules fire and resolve per group, and the new audit log records each query run with its full text. By code changed it is the largest Logchef release so far: 171 commits since v2.7.0 and 18 database migrations on each metadata store.
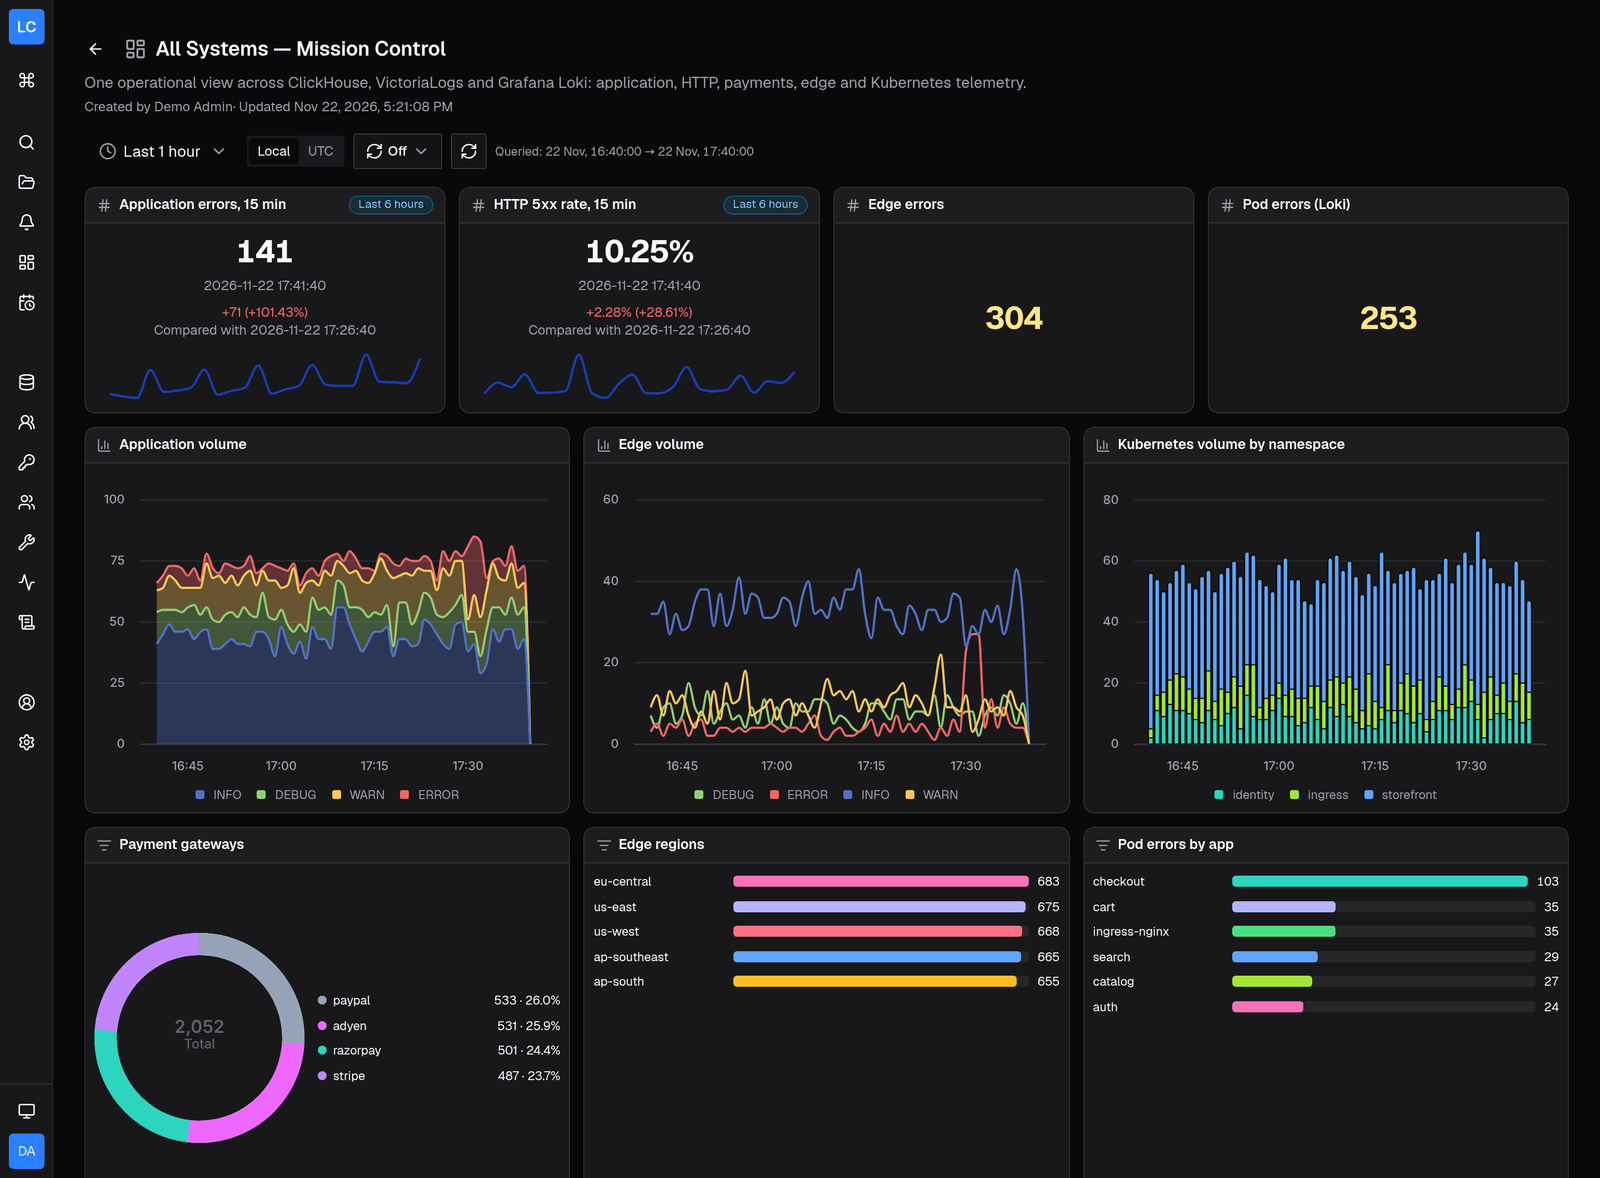
Browse the full visual walkthrough on logchef.app/changelog/#v2.8.0, or test the three-engine compiler in the LogchefQL Playground.
Warning
This release needs downtime. Back up the metadata database, then stop every old replica before the first new one starts. The alert migrations cannot be undone: rolling back means restoring the backup. Read Upgrading first.
Grafana Loki
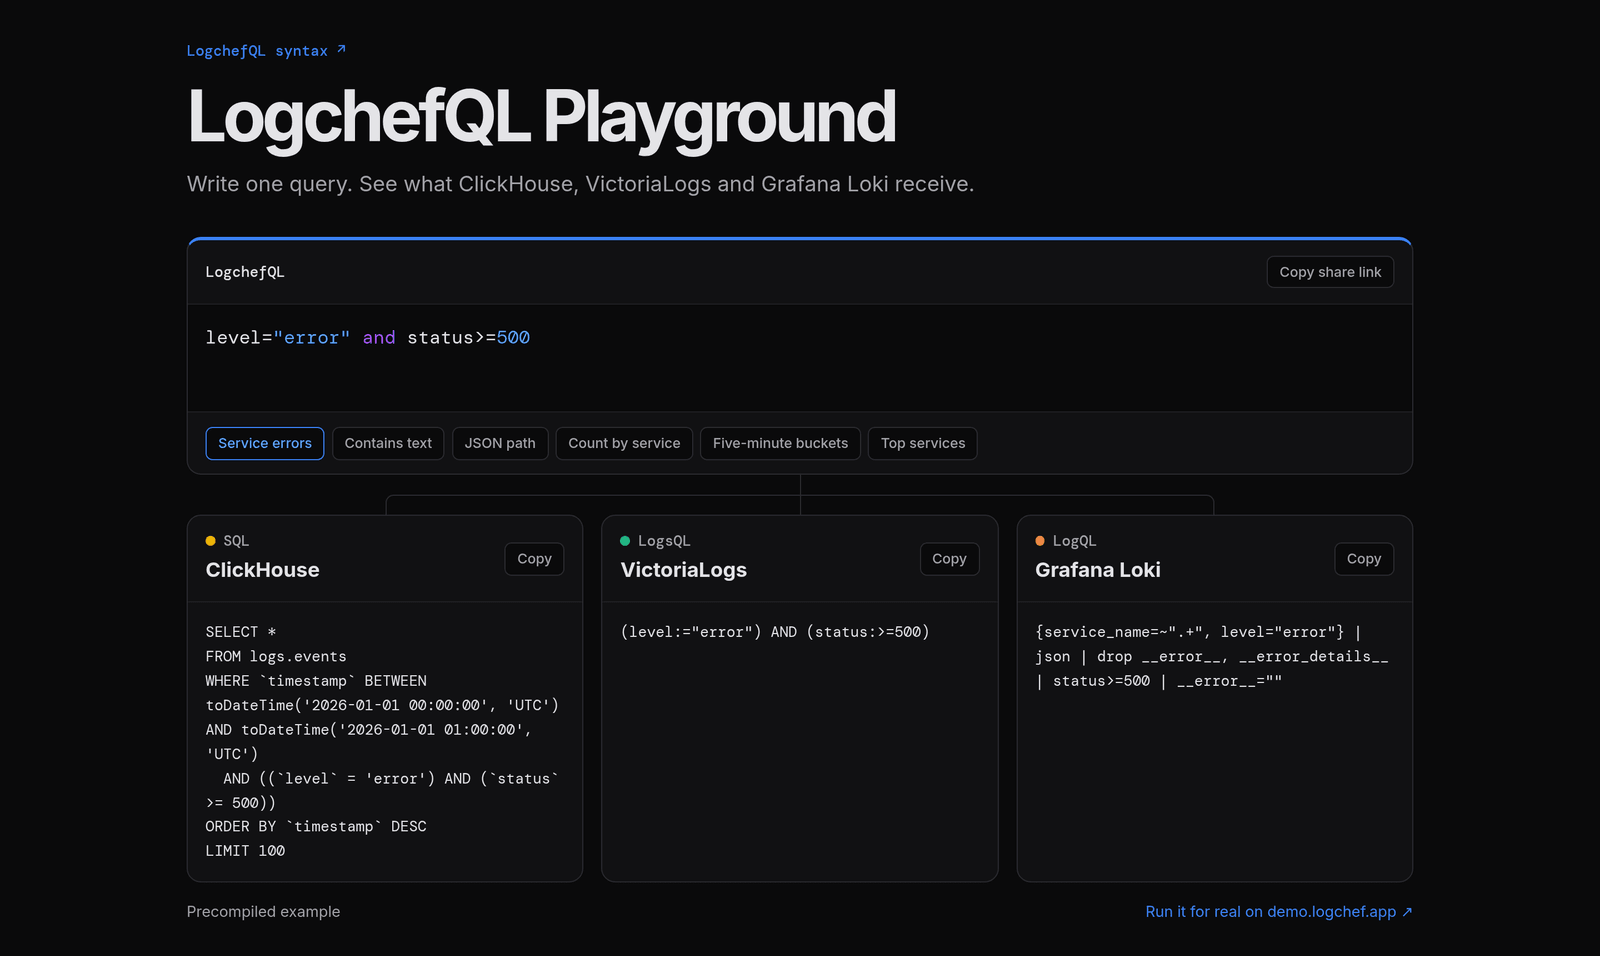
Point Logchef at a Loki tenant and search it with LogchefQL or native LogQL. LogchefQL compiles to LogQL: a top-level condition on a stream label joins the selector, a condition on _msg becomes a line filter, and the rest becomes a label filter after the parser. On a source with the selector {service_name=~".+"} and the JSON parser, the first query below compiles to the second:
level="error"
{service_name=~".+", level="error"} | json | drop __error__, __error_details__
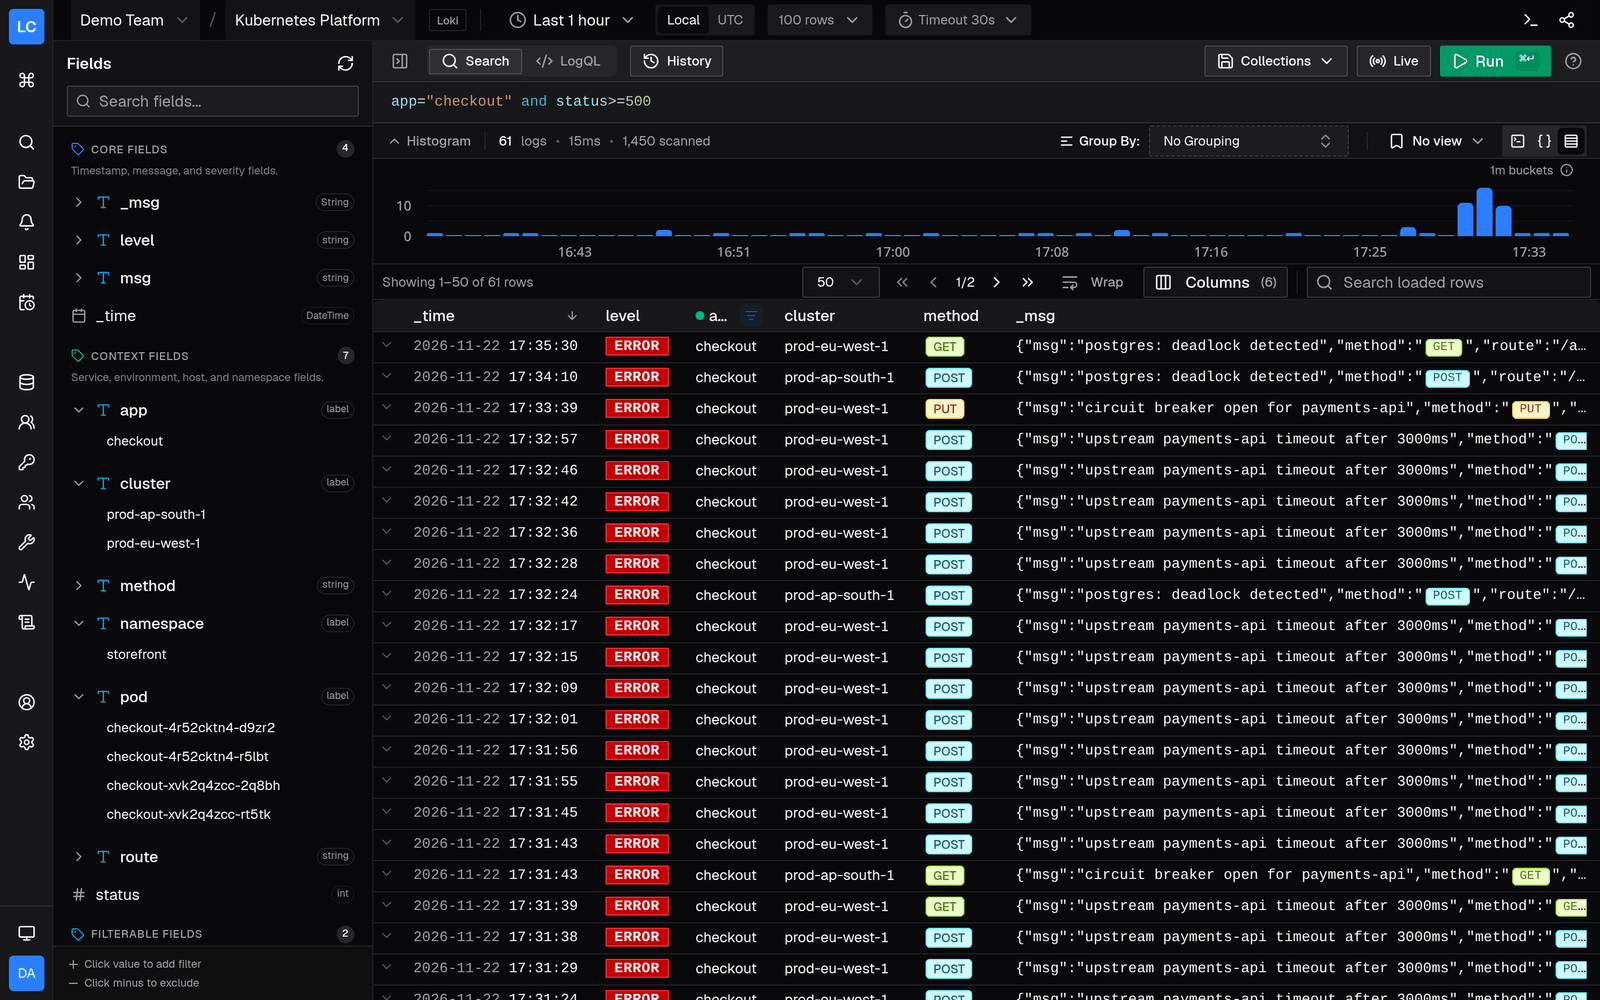
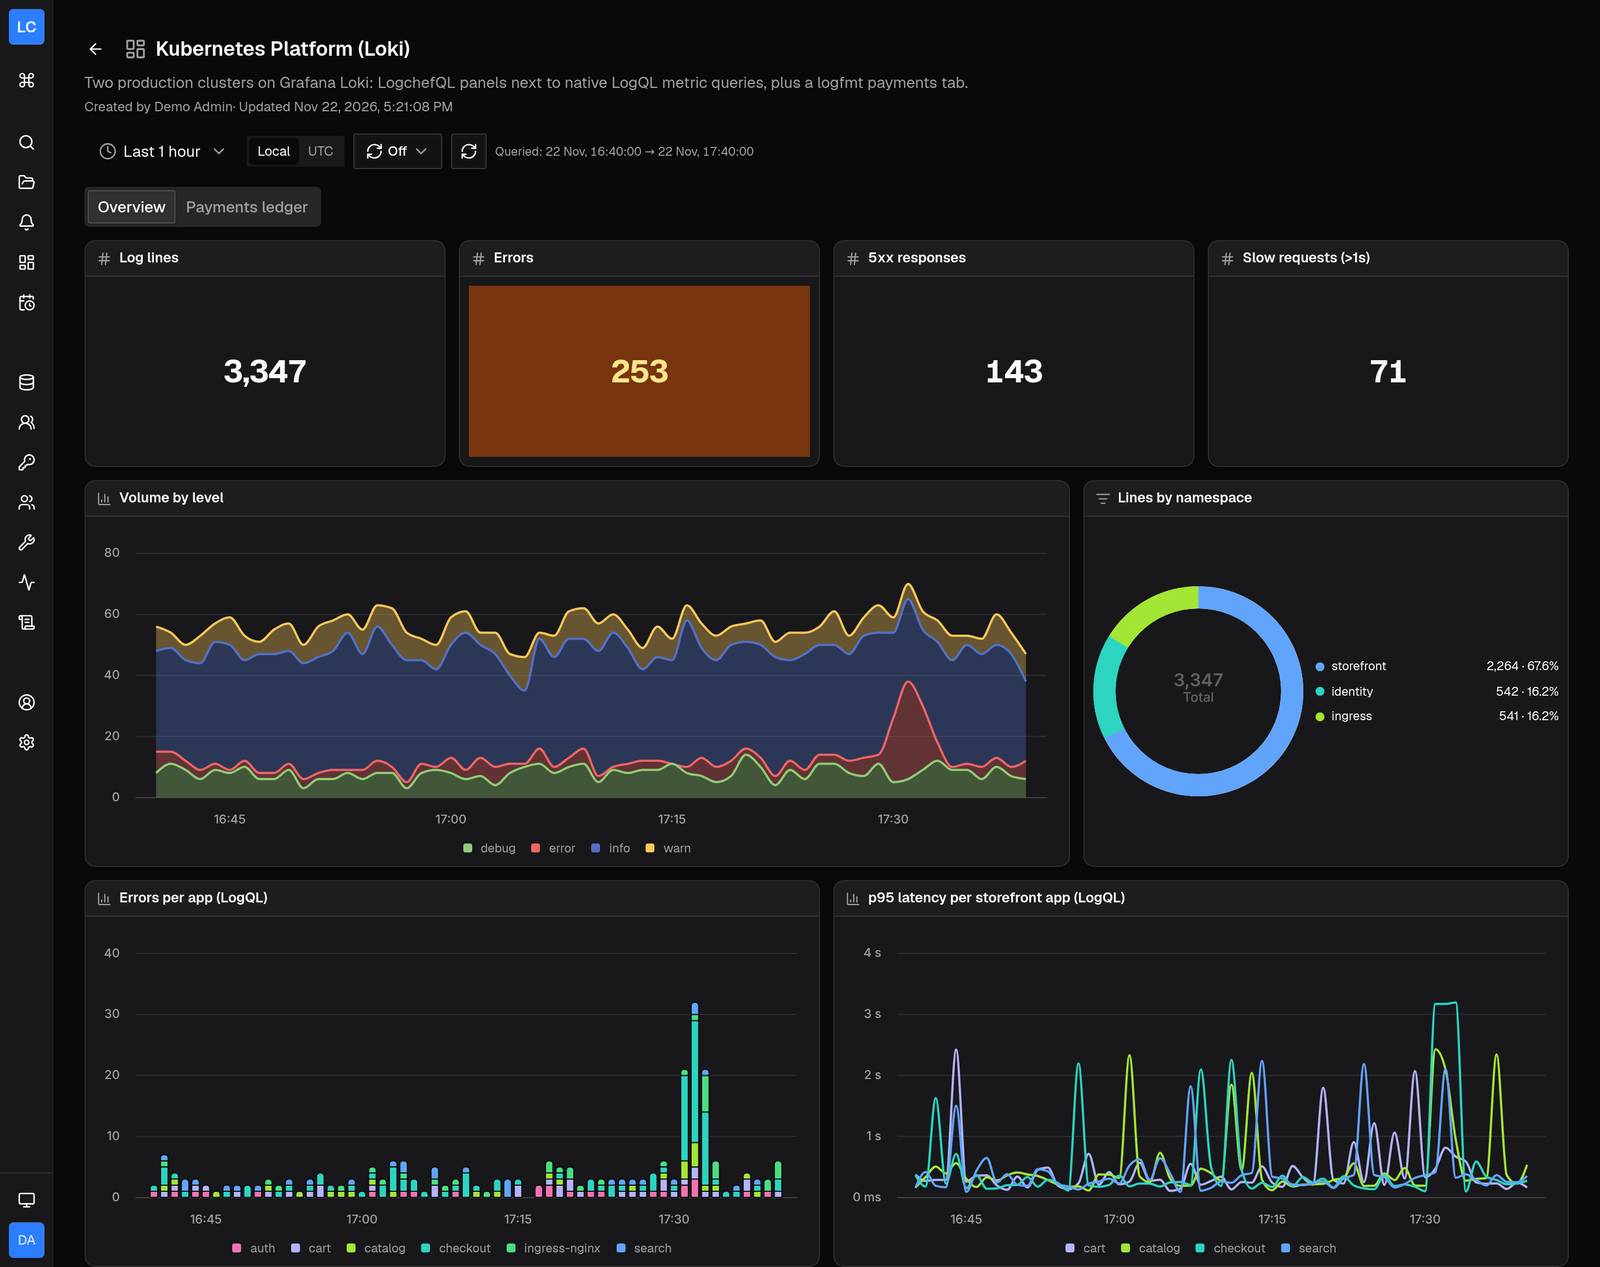
The LogQL tab runs native LogQL as written, paged past Loki's per-request entry limit. The histogram, field sidebar, live tail, per-stream log context, saved queries, dashboards, alerts, AI query generation, the CLI and the MCP server all work on Loki.
Why it matters: teams on Loki get the same saved queries, dashboards, alerts and team access that ClickHouse and VictoriaLogs teams have, from one UI. Logchef never writes to Loki.
A Loki source gives the teams it is linked to the whole tenant: the default selector does not restrict native LogQL. Exports, windowed search and LogchefQL aggregations are not available on Loki. Grafana Loki tutorial · LogQL Queries
LogchefQL aggregations
A pipe after the filter counts and summarizes the matching logs:
level=error | count() by service
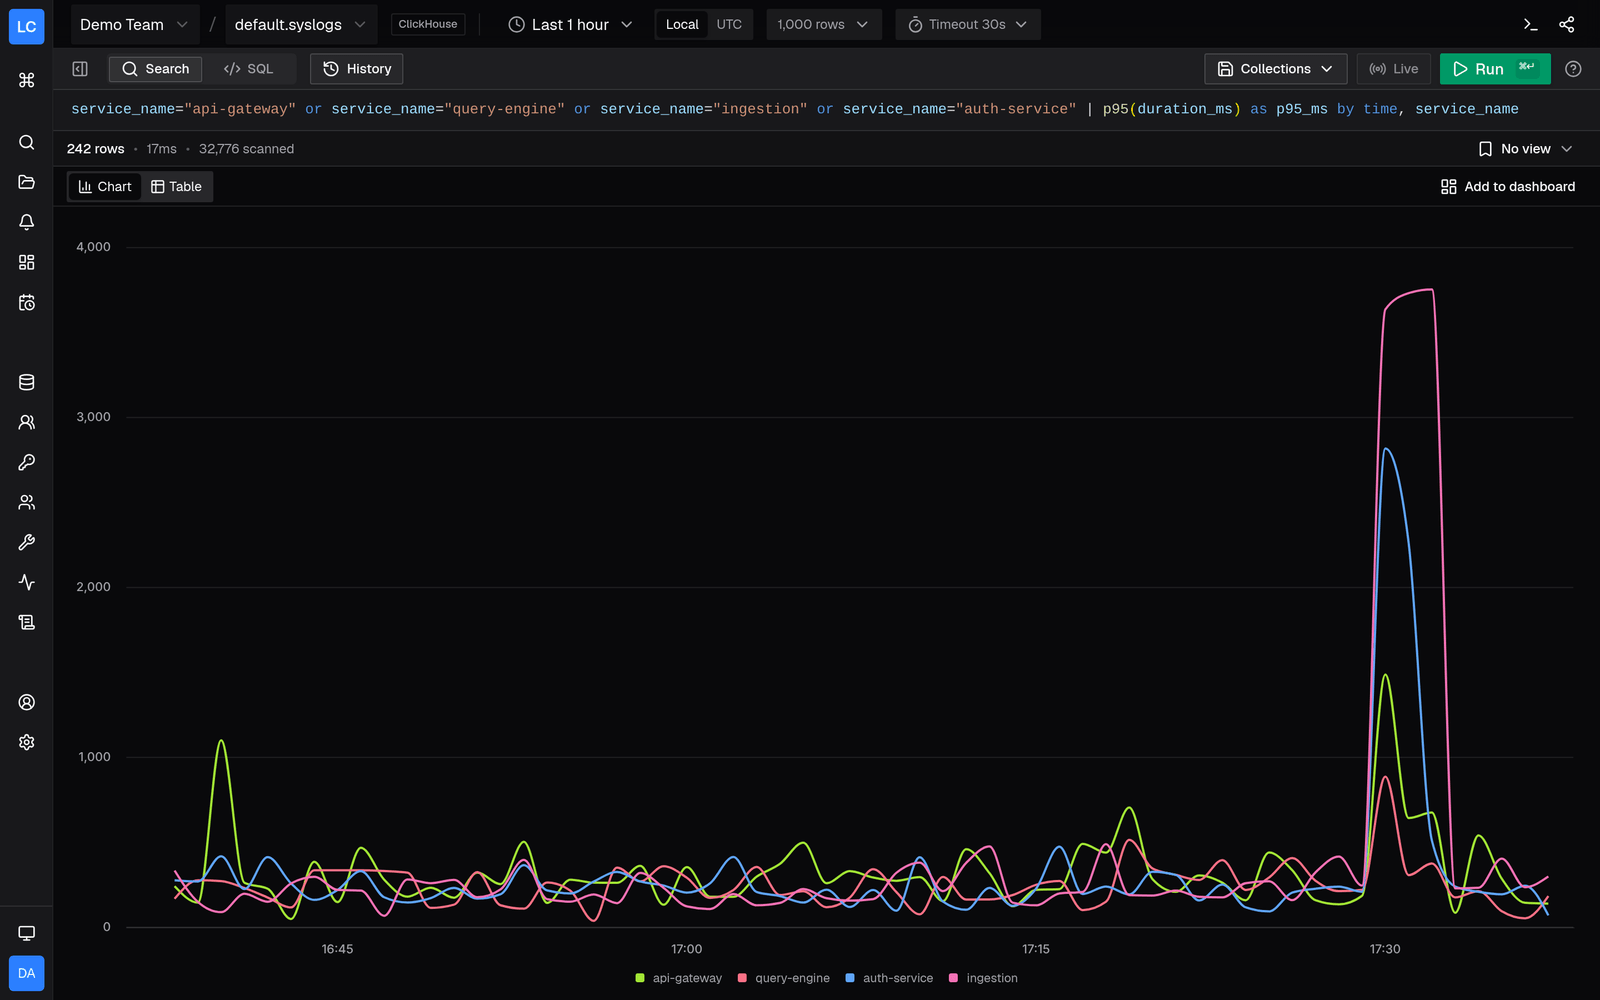
service=api | p95(duration_ms), avg(duration_ms) by time(5m)
The functions are count, count_distinct, sum, avg, min, max, p50, p75, p90, p95 and p99, with up to 5 by keys and optional | sort and | limit stages. The same text runs on ClickHouse and VictoriaLogs. The Explorer shows the result as a table or a chart, and Add to dashboard opens the panel builder with a result panel filled in from the query.
Why it matters: a count, a percentile or a group-by no longer needs SQL or LogsQL, or a rewrite for each backend. Aggregations
Alerting v2
One rule can now watch every service:
status_code >= 500 | count() as value by service
With Group by service, each group fires, notifies and resolves on its own. Native queries group too:
sum by (service) (count_over_time({app="shop"} |= "error" [5m]))
- No-data policy: compare an empty result with the threshold as 0, open a no-data episode, or keep the state.
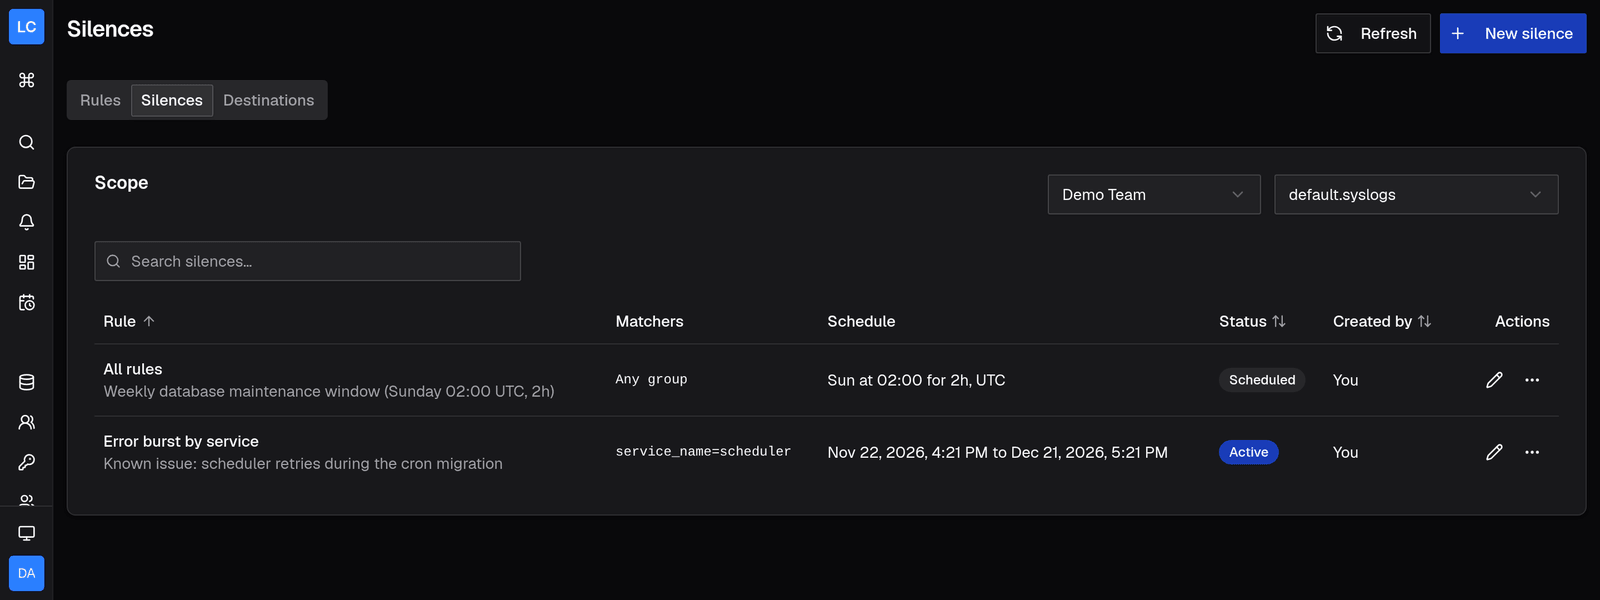
- Silences: mute one rule or all of a source's rules, once for up to 30 days or weekly for maintenance windows. Evaluation and history continue.
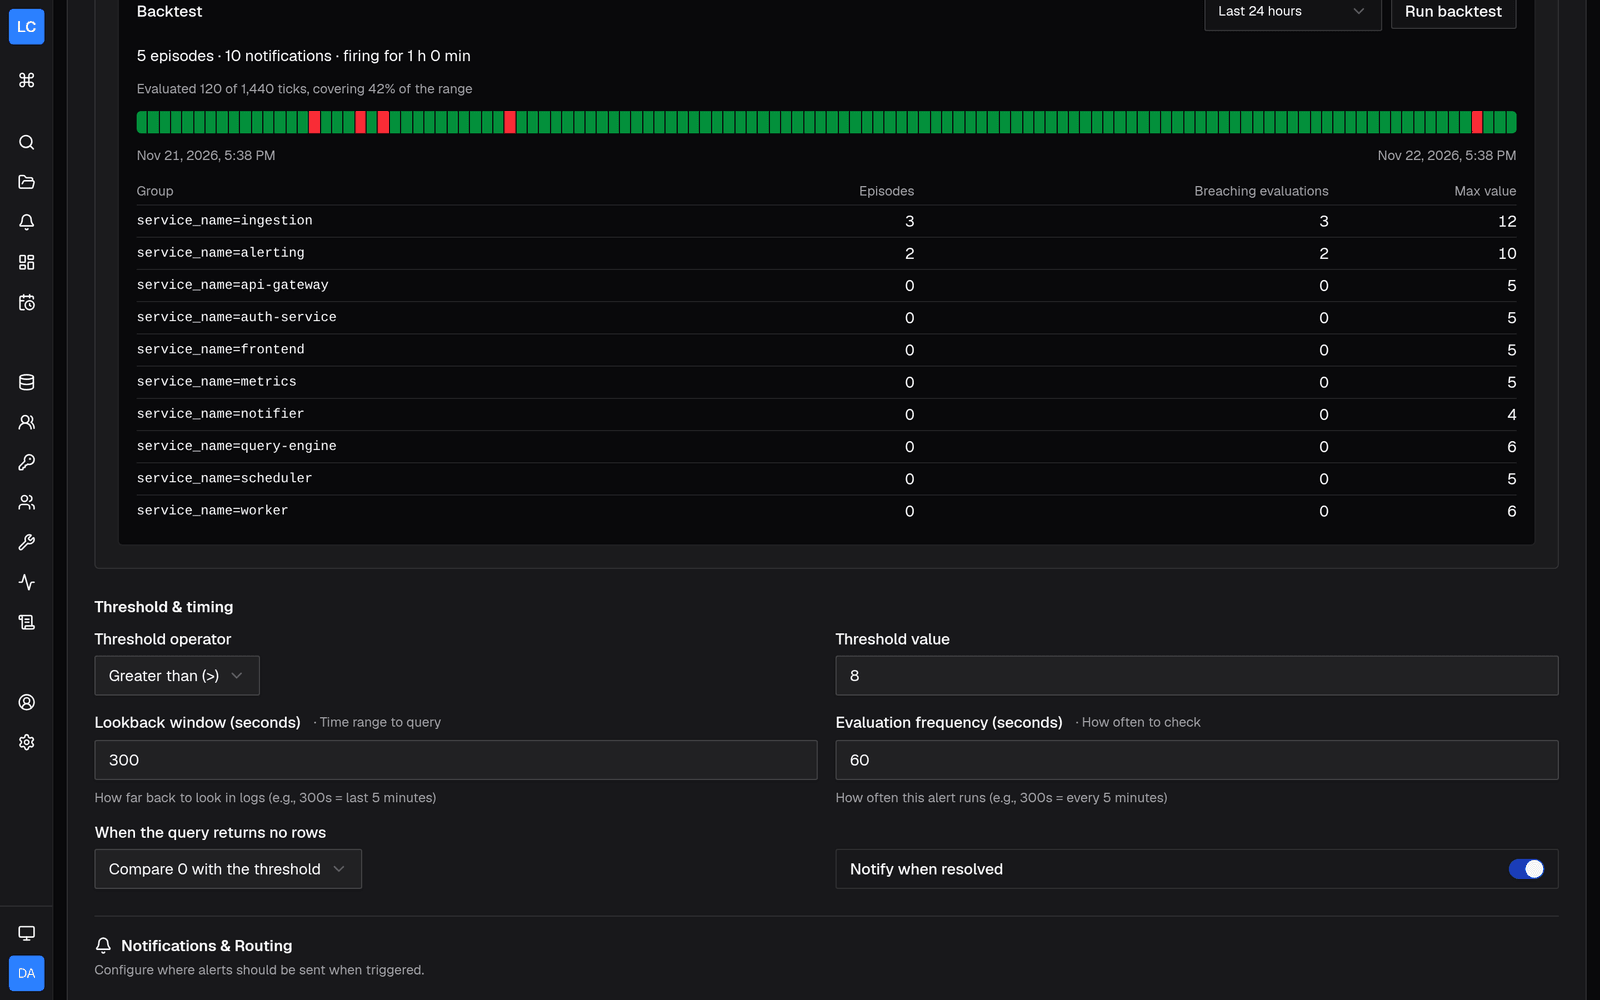
- Backtest: Run backtest replays an unsaved rule over the last hour, 6 hours, 24 hours or 7 days and shows what it would have sent.
- Destinations: reusable email, webhook, Slack and PagerDuty targets, private, team or global. PagerDuty gets one
dedup_keyper group. - Delivery queue: retries after 30 seconds, 2, 10 and 30 minutes, with every attempt recorded on the history entry.
Why it matters: one rule replaces a rule per service, maintenance windows stop paging people, and you see how noisy a rule is before you save it. Alerting
Audit log
Logchef records configuration changes, sign-ins, OAuth consent, exports and query runs. A query.run event holds the full query text, the time range, the rows returned and scanned, the duration and the outcome. That includes queries from the Explorer, dashboards, the CLI and the API, plus every live tail session, log context read, and MCP or Ask Chef tool call that reads logs. The histogram and the field sidebar do not record events yet.
logchef audit list --action query.run --since 24hWhy it matters: you can answer who read which logs, over which time range, and what an AI agent ran on someone's behalf. Global admins browse events in the UI, read them through GET /api/v1/admin/audit-events, or ship each event off the host as a JSON log line. Audit Log · Release walkthrough
Query Activity, rebuilt
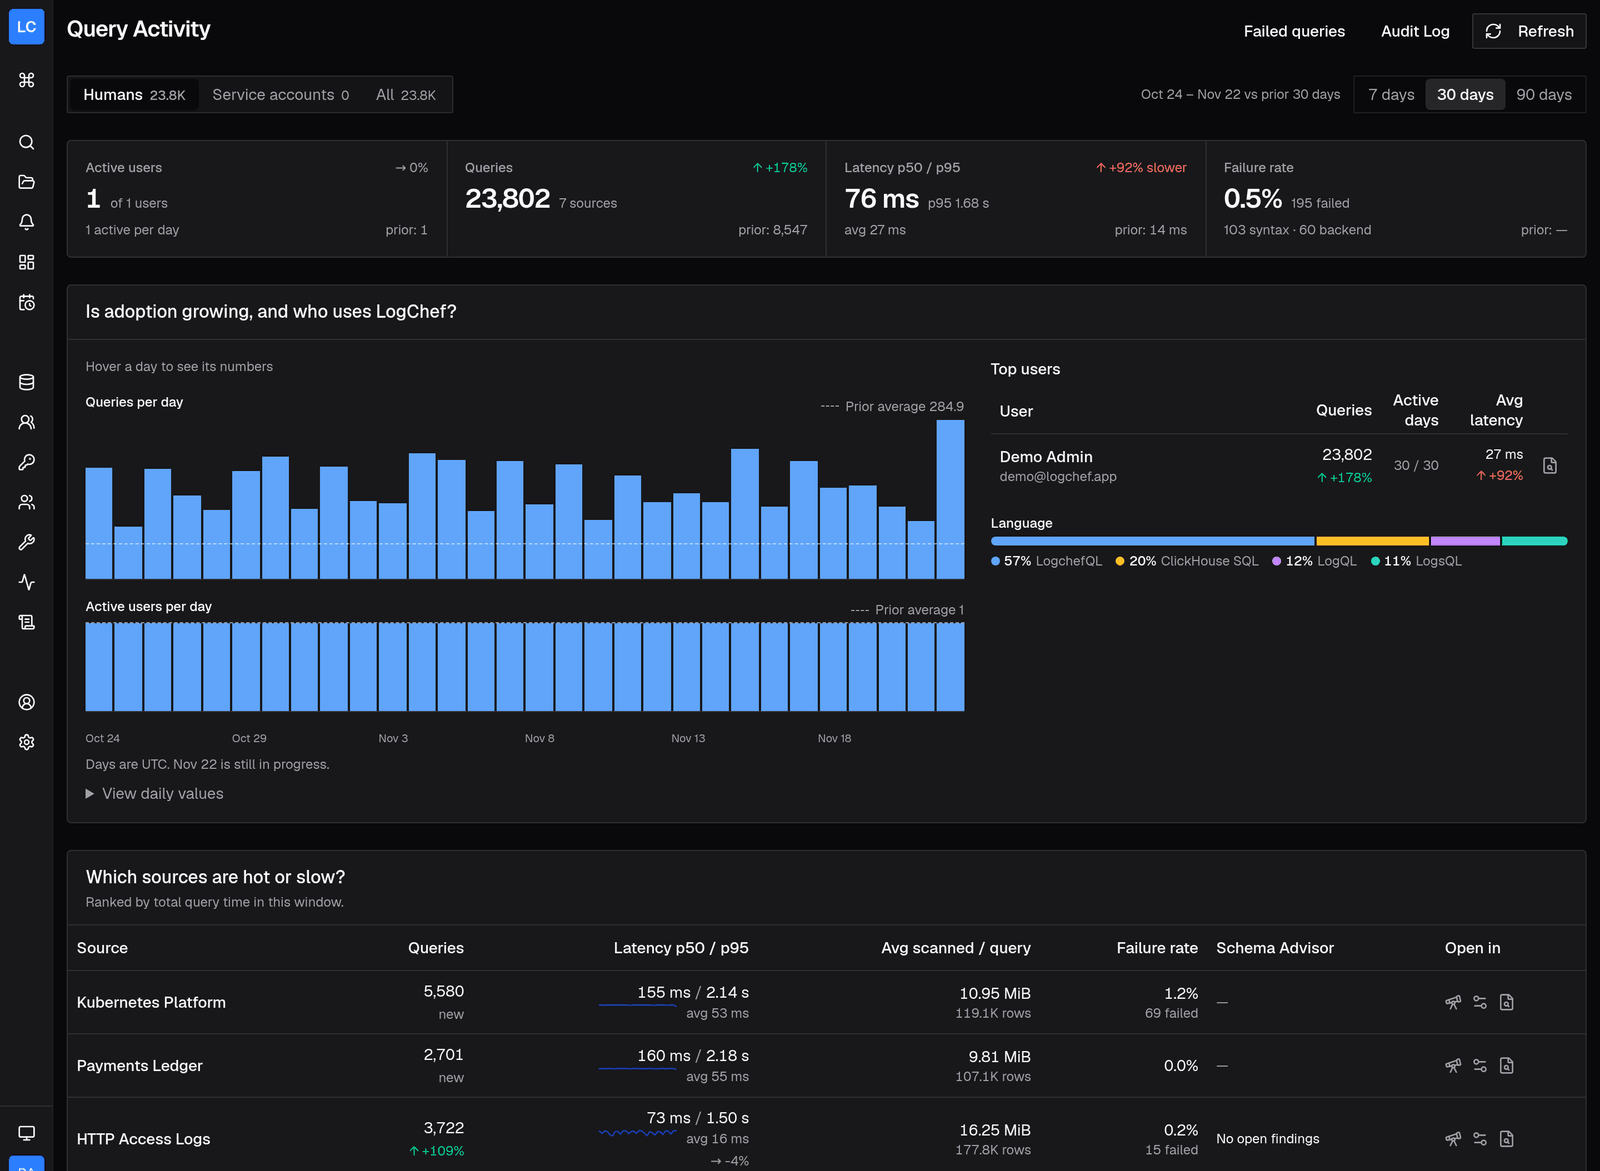
Administration → Query Activity shows who uses Logchef, which sources are busy or slow, and which repeated query patterns cost the most. Each number compares with the window of the same length before it, with latency percentiles, scan cost and failure rates. Click a source or a user to scope the whole page.
Why it matters: you find the expensive query pattern and the slow source before your users report them. Sources show their open schema advisor findings.
Scheduled reports
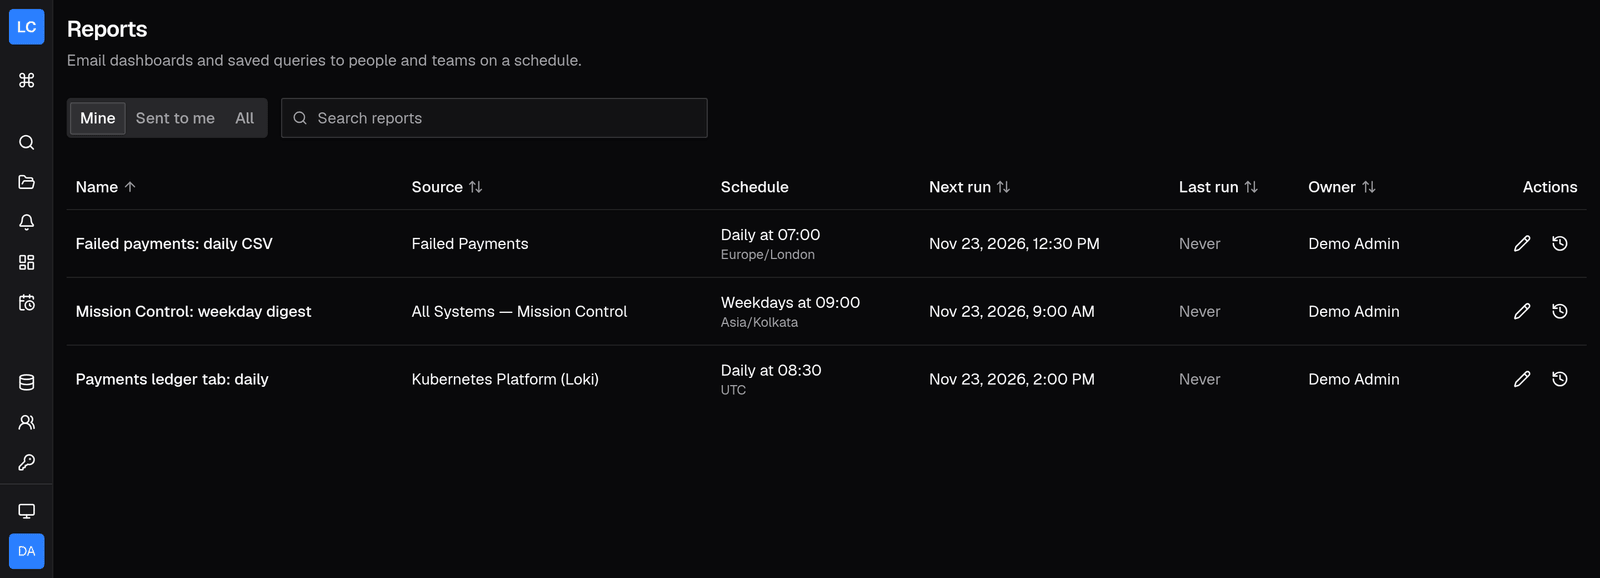
Email a dashboard, one dashboard tab or a saved query every hour, day, week or month, in the report's own timezone. Stat panels become tiles, charts become bar tables, and a saved query can attach its rows as CSV. Each run checks the owner's access, and each Logchef recipient's copy locks the panels that recipient cannot see. External addresses need a global admin to allow them. Scheduled Reports
Saved Explorer views
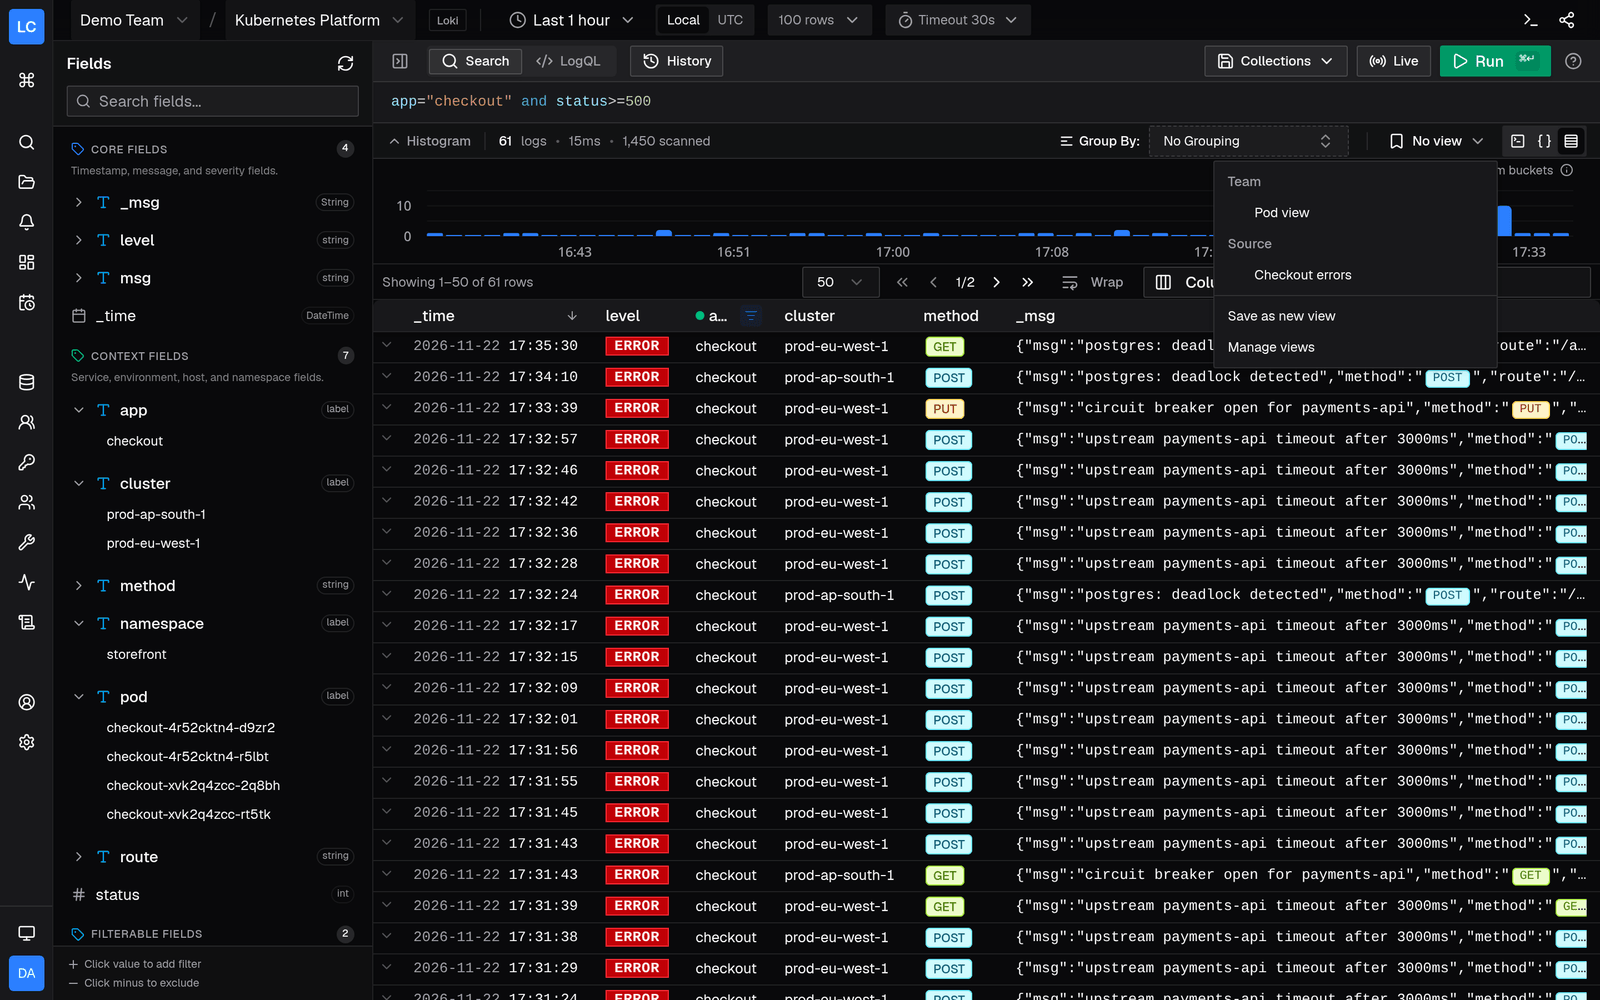
Save a source's columns, widths, sort and display mode, with an optional filter and relative time range, as a personal, team or source view. Each scope can set a default view, and a share link carries your layout. Provisioning can declare managed views. Saved Views
Shared dashboard editing
Team owners, admins and editors can edit a shared dashboard when they have edit rights on every team its query panels use. Only the creator and global admins can delete it. Dashboards
ClickHouse schema advisor
Logchef records the filter shape of each Explorer query on a ClickHouse source (columns, Map keys and JSON paths, never values). Run analysis joins those shapes with the table's metadata and suggests bloom filter and text indexes, materialized columns, LowCardinality, codecs, and reviews of sorting keys, partition keys and retention. Each finding shows its evidence and any suggested DDL. Logchef never runs the DDL.
logchef advisor app-logs --refresh
logchef advisor app-logs --ddl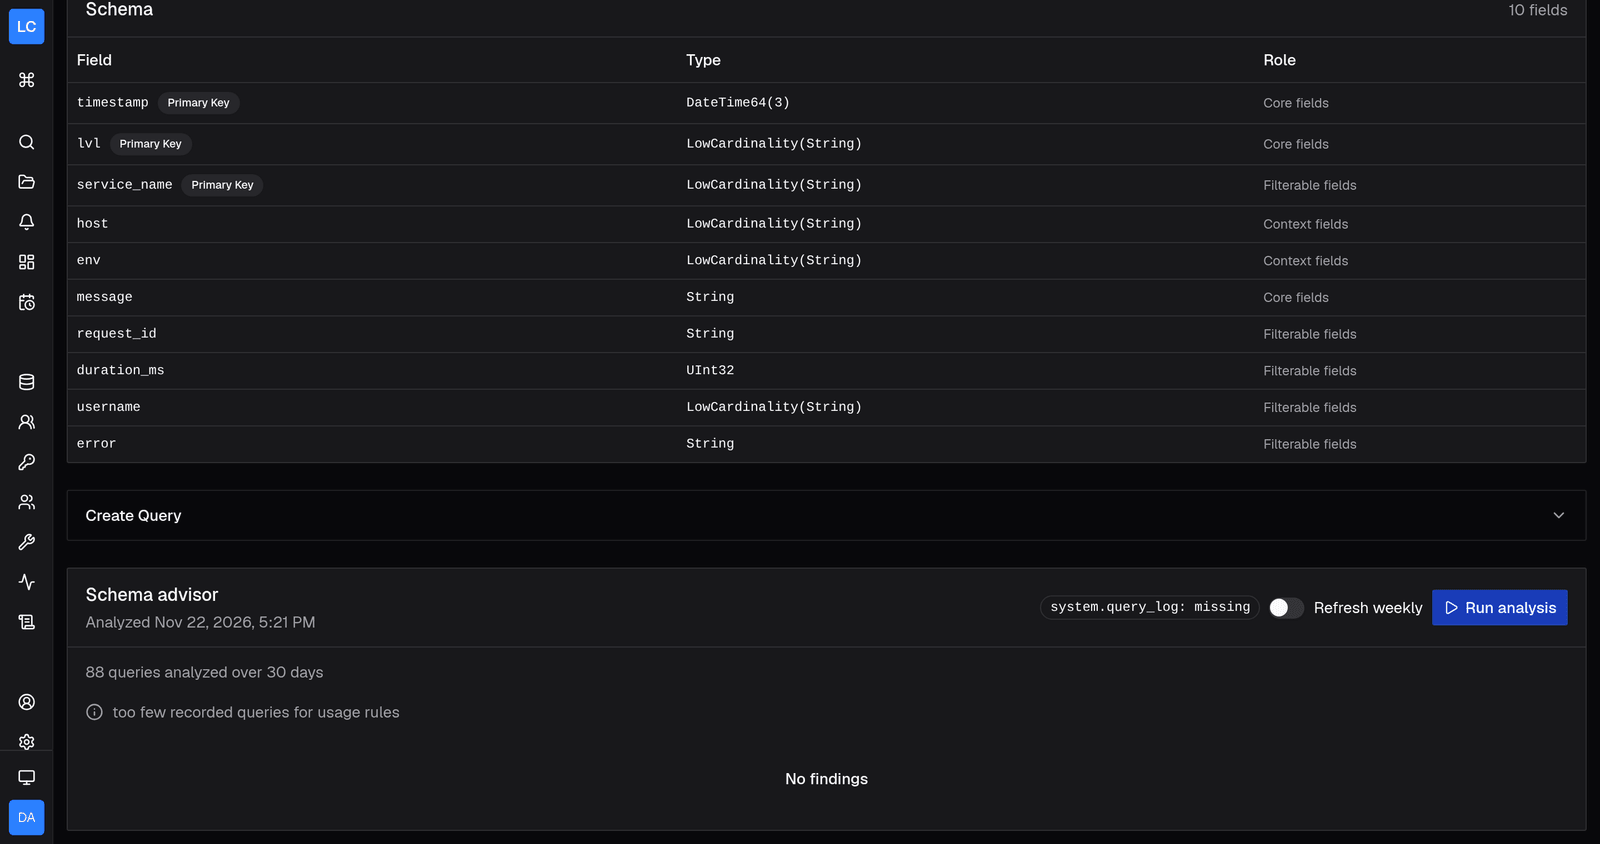
MCP and CLI
The MCP server has 22 read-only tools. Agents can query Loki, run aggregations through query_logchefql, list saved views with list_saved_views, and see alert groups, silences and deliveries. With OAuth enabled on the server, one command connects Claude Code:
claude mcp add --transport http --client-id logchef-mcp logchef https://logchef.example.com/mcpLogchef CLI 0.5.0, released alongside, adds logchef advisor, logchef audit list, logchef reports, logchef views list and logchef open --view, runs LogQL through logchef sql, and prints aggregations as tables:
logchef query 'level=error | count() by service' --since 1h
logchef sql '{service_name="payments-api"} |= "gateway"' --since 1hLogchefQL Playground
Write one LogchefQL filter or aggregation in the browser and compare the compiled ClickHouse SQL, VictoriaLogs LogsQL and Grafana Loki LogQL side by side, with shareable links and zero setup. Open the Playground
Security
- Linking a source to a team now requires access to that source. Before, a team admin who was not a global admin could link any source to their team and query its logs.
- Provisioning export no longer writes custom header values of VictoriaLogs and Loki sources. It writes
header_secret_refsentries that name environment variables instead. - A failed webhook delivery no longer writes the receiver's response body to the server log.
Upgrading
- Back up the metadata database. Startup runs 18 migrations on each store (SQLite 000042 to 000059, Postgres 000016 to 000033). The alert migrations move each rule's targets into destinations, and the down migrations do not put them back.
- Stop every old replica, then start the new version. A rolling upgrade is not supported: an old binary writes alert columns that no longer exist.
- Update the config. Remove
alerts.evaluation_interval. At least one replica needs bothjobs.enabled = trueandalerts.enabled = true(both default totrue). Review the new[audit]limits:retention_days(default 30) andmax_rows(default 1,000,000), which eachquery.runevent now counts toward. - Check SMTP in Administration → System Settings → Alerts if you send alert or report email.
- After the upgrade, reload open Logchef tabs. Reissue API tokens that need the new scopes. Run
logchef authagain for saved views in the CLI, and sign MCP clients in again to seelist_saved_views. - Webhook receivers: migrated webhooks stay on payload version 1. Delivery is now at least once, so a receiver that must not act twice should drop a repeated
Logchef-Delivery-Id. Move each receiver to version 2 when it is ready.
Existing rules keep their behavior: each becomes an ungrouped rule with the zero no-data policy and resolved notifications on. The CHANGELOG upgrade notes list every migration, config key and API change.
Breaking changes
- Rolling upgrades: not supported for this release. Stop every old replica first.
- Alert API: a create or update that contains
recipient_user_idsorwebhook_urls, even as an empty array, answers 400. Create a destination withPOST /api/v1/notification-destinationsand pass its ID indestination_ids. Alert responses no longer include the two fields. - Alert frequency: a
frequency_secondsbelow 10 answers 400 on create and update. An existing rule below 10 seconds runs every 10 seconds. - Webhook test route:
POST /api/v1/admin/settings/test-webhookand the webhook test dialog in Administration are removed. UsePOST /api/v1/notification-destinations/testor Send test on a destination, and checkdata.ok: an HTTP 200 can include a failed delivery. - Config:
alerts.evaluation_interval(andLOGCHEF_ALERTS__EVALUATION_INTERVAL) is removed. Logchef ignores it, and a migration deletes its stored setting. - Notifications: a grouped rule sends one notification per group to every destination type. Webhook requests carry
Logchef-Delivery-Id, and delivery is at least once. - Query Activity API:
GET /api/v1/admin/query-activityis removed.GET /api/v1/admin/query-statstakesaccount,source_idanduser_idand returns a new payload without the old fields. - Token scopes:
saved_views:read,saved_views:write,destinations:read,destinations:write,reports:read,reports:writeandaudit:readare new. A token issued with an explicit scope list, including the Read-only and Alerts manager presets, gets 403 on those routes until it is reissued. Full access tokens are unaffected.audit:readis in no preset and is not an OAuth scope, and OAuth sign-ins cannot reach reports. - Team source links: linking a source you cannot access to your team now fails as source not found. Global admins and provisioning are unaffected.
- Provisioning export: custom header values of VictoriaLogs and Loki sources export as
header_secret_refsenvironment variable names. Provisioning refuses to start when a referenced variable is empty or not set.
Contributors
Thanks to @sujay2306 for the fix that requires source access before a team admin can link a source to a team (#279).
Try it
- Live demo: https://demo.logchef.app
- Docs: https://logchef.app, starting with the quick start and the Grafana Loki tutorial
- Release post: https://logchef.app/blog/logchef-2-8-grafana-loki-ui-log-analytics/
- Run it locally with a built-in admin account, then sign in at http://localhost:8125 and add a source:
docker run --rm -p 8125:8125 -v logchef-data:/data \
  -e LOGCHEF_AUTH__API_TOKEN_SECRET="$(openssl rand -hex 32)" \
  -e LOGCHEF_AUTH__LOCAL__ENABLED=true \
  -e LOGCHEF_AUTH__LOCAL__ADMIN_EMAIL=admin@example.com \
  -e LOGCHEF_AUTH__LOCAL__ADMIN_PASSWORD=change-me-please \
  -e LOGCHEF_SERVER__SECURE_COOKIE=false \
  ghcr.io/mr-karan/logchef:v2.8.0
Full changelog: https://github.com/mr-karan/logchef/blob/main/CHANGELOG.md