stacked bar chart does not display text when colour is supplied #2247
Description
or vice versa - color attribute is ignored
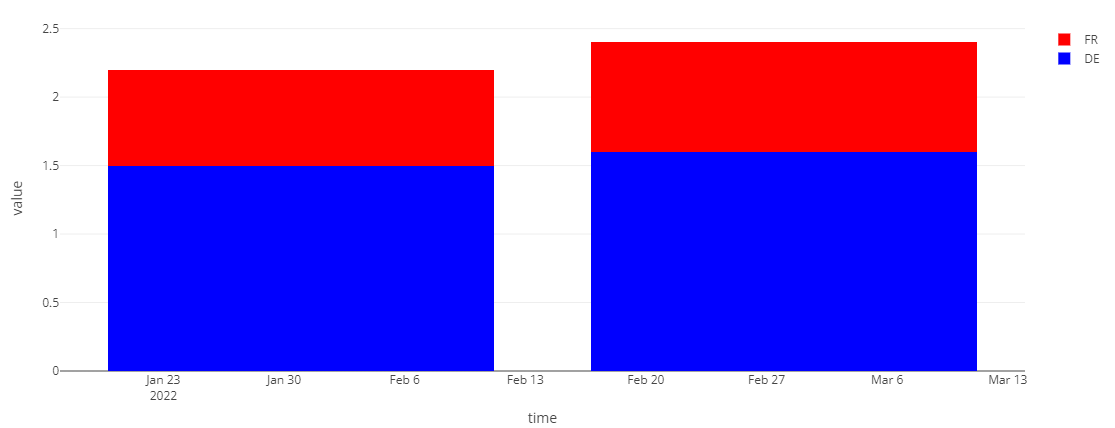
I would like to have stacked bar chart with specific colours & labels for each value, but in current setting color is ignored or the text labels disappear:
library(data.table)
library(plotly)

x <- structure(
  list(time = structure(c(19023, 19023, 19051, 19051), class = "Date"),
       group = structure(c(2L, 1L, 2L, 1L), levels = c("FR", "DE"),
                     class = c("ordered", "factor")),
       value = c(1.5, 0.7, 1.6, 0.8)), row.names = c(NA, -4L),
  class = c("data.table", "data.frame"))
x

my_col <- c('red', 'blue')

plot_ly(x, x = ~time, y = ~value, type = 'bar'
        , name = ~group
        , colors = my_col # ignored
        , text = ~ value, textposition = 'auto'
        ) %>% layout(barmode = 'stack')
# when adding color we lose text:
plot_ly(x, x = ~time, y = ~value, type = 'bar'
        , name = ~group
        , color = ~group
        , colors = my_col
        , text = ~ value, textposition = 'auto'
        ) %>% layout(barmode = 'stack')
# text isnt visiable

plot_ly(x, x = ~time, y = ~value, type = 'bar'
        , color = ~group
        , colors = my_col
        , text = ~ value, textposition = 'auto'
) %>% layout(barmode = 'stack')
# text isnt visiable