Data sources
For blue teams it is crucial to know what data (log) sources you have, what the quality is, and if it can be used in data analytics. Having that, you know if you can find certain attacker behaviours (which make themselves visible in one or more data sources) or if you can build new detections.
One of the first steps in using DeTT&CT is making an inventory of your data sources by scoring (as explained here and here) the data quality (described here). ATT&CK has over 30 different data sources, which are further divided into over 90 data components. All of the data components are included in this framework.
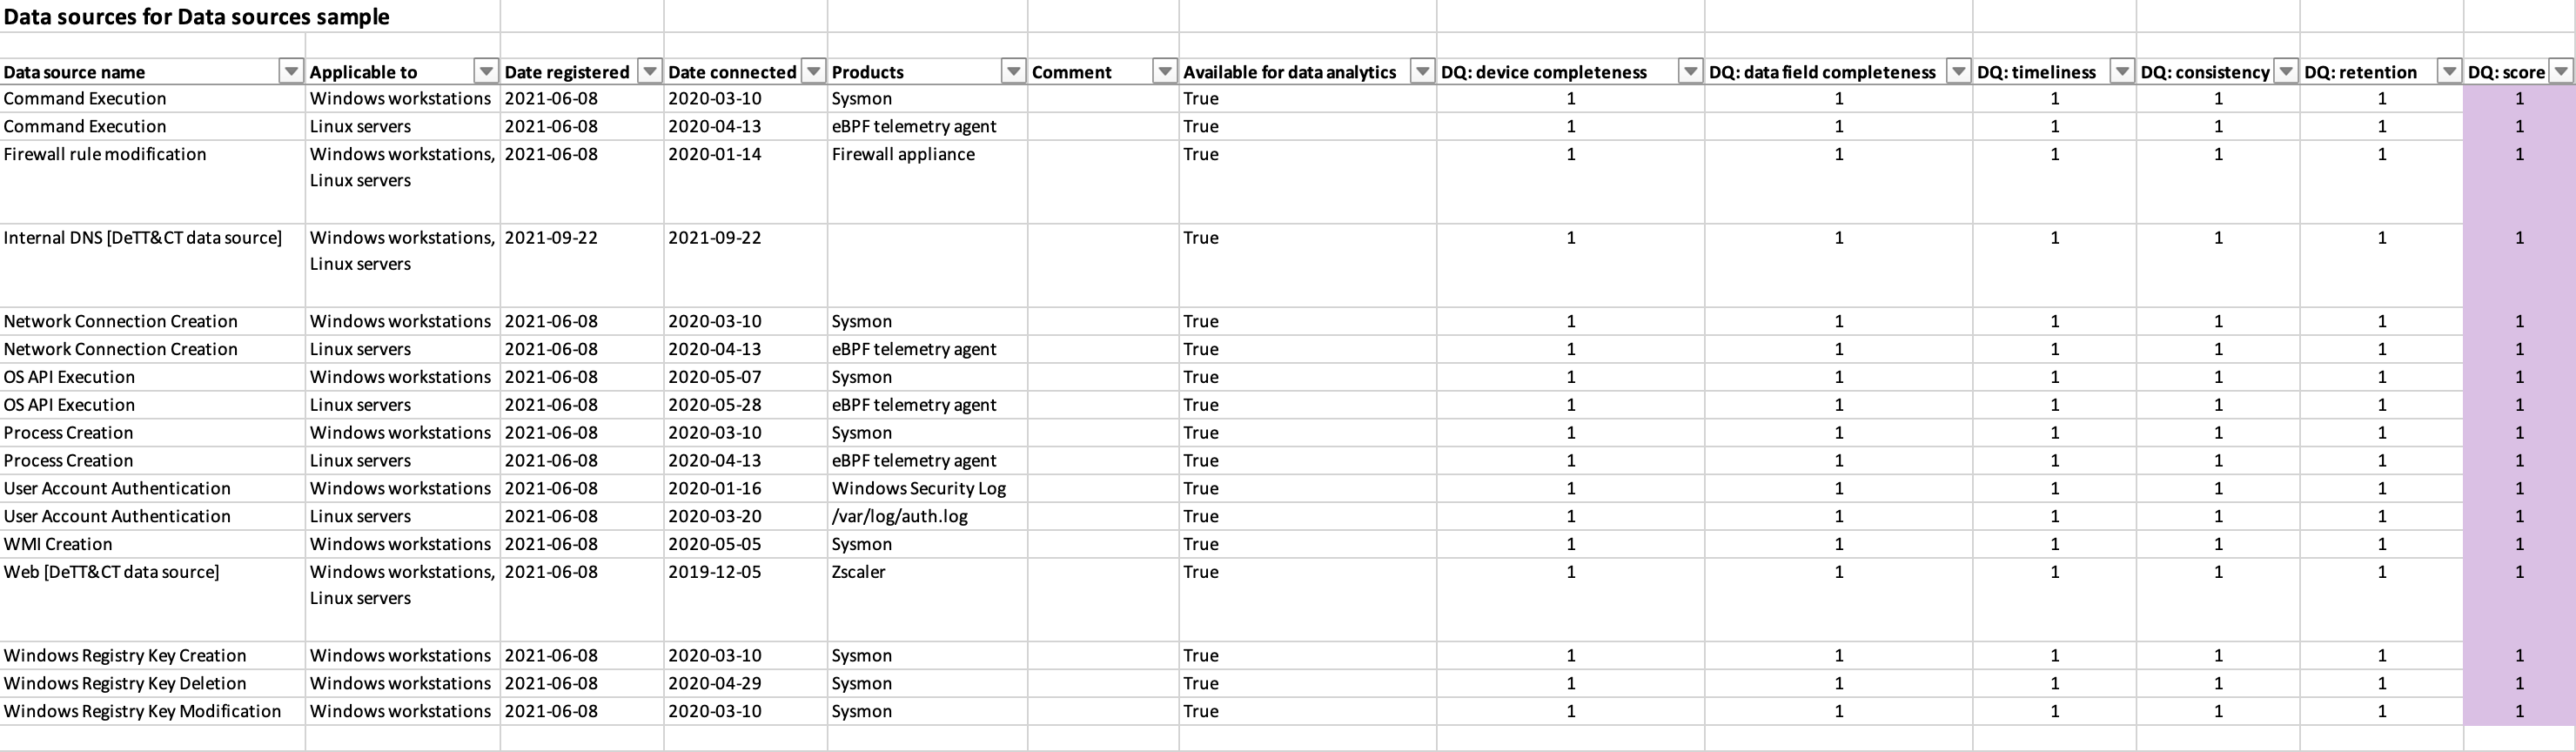
Using the YAML data source administration file you can administrate all of your data sources and record the following:
- The date when you registered the entry in DeTT&CT.
- The data when you connected the data source to your security data lake.
- In which product(s) the data resides.
- The type of system(s) the data source applies to.
- A flag to indicate if the data source can be used in data analytics.
- A possible comment.
- We recommend making use of
|to have multiline comments in the Excel output. For more info have a look at: https://yaml-multiline.info/.
- We recommend making use of
- Data quality. Explained here.
- You can add anything else you want to record by adding your own key-value pairs.
You can find an example data source administration YAML file here. Do not forget to into account which data sources are applicable per platform as described on this page.
Based on the data sources defined and scored in the data source administration file. DeTT&CT can generate an ATT&CK Navigator layer file. The data sources are mapped to the ATT&CK techniques to visualise your rough visibility coverage. This gives you a rough overview of your potential visibility coverage. Often, this is the first step in getting an overview of your actual visibility coverage (see: How to use the framework).
To generate a layer file for the ATT&CK Navigator based on the data sources administration file, you can run the following command:
python dettect.py ds -fd sample-data/data-sources-endpoints.yaml -l

You can generate an Excel sheet containing all your data sources, attributes, notes and data quality scores:
python dettect.py ds -fd sample-data/data-sources-endpoints.yaml -e