A shiny based GUI version of ggplot2.
This source code is based on the idea of this paper.
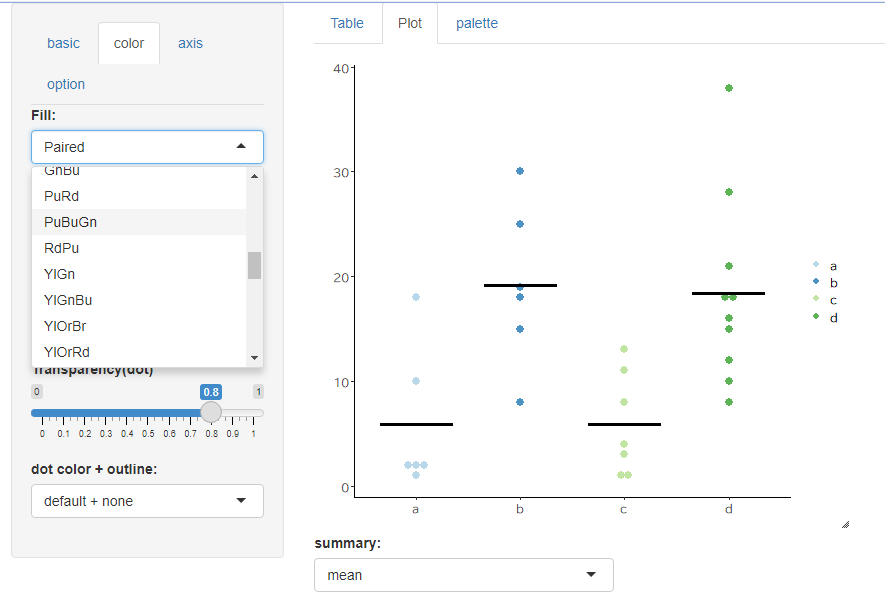
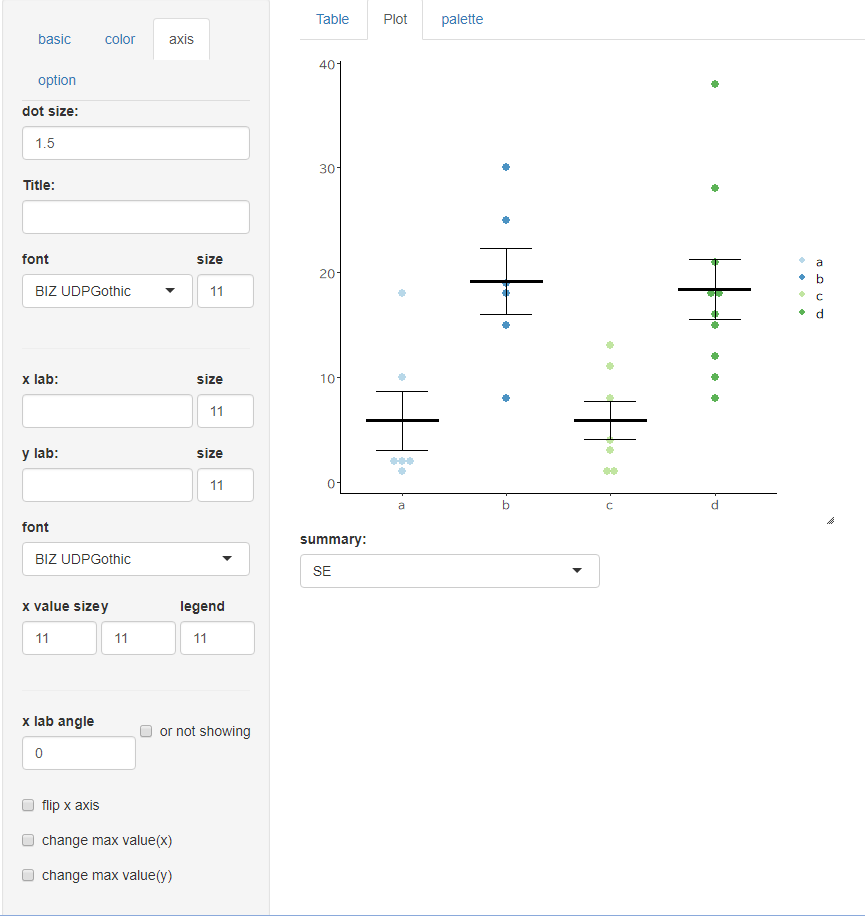
Therefore, dot plots and box plots are provided, but no bar plots.
Detailed settings such as color, font, and graph size are available.
There is an optional feature to bookmark and restore various values. This saves you from having to set the values again and again.
-
Bookmark them in the Options tab and save them in an RDS file.
-
When you restore, upload that RDS file. Due to specifications, you have to upload the data file after restoring the configuration.
R.studio is 2021.09.0+351, R is 4.1.1.
The data file can be a CSV file or an xlsx file.
Also, the first row should have a data label and be a long vertical data array. A sample data is attached. Please check it out.
- This is the easiest way. However, it is not designed for online use, and some features may not be available (e.g., changing fonts).
-
Use offline
a. Install the missing .
b. Create a folder in C:\Users\your user name\Documents\R and store each R file and www.
c. Start Rstudio and double-click the downloaded "ggplot2_GUi.Rproj" in the lower right window.
d. Click ▶ Run App.
Secondary distribution is strictly prohibited.
ggplot2をshinyベースでGUI化したものです。
このソースコードはこの論文の考えのもと、作成されています。
したがって、ドットプロットおよび箱ひげ図が用意されていますが、棒グラフはありません。
色やフォント、グラフのサイズなど細かい設定を用意しています。
さまざまな値をブックマークし、復元するオプション機能があります。これによって、なんども値の設定をせずに済みます。
-
1.オプションタブでブックマースし、RDSファイルで保存します。
-
2.復元する際、そのRDSファイルをアップロードします。仕様上、設定を復元したあとにデータファイルをアップロードしなければなりません。
R.studioは2021.09.0+351、Rは4.1.1です。
データファイルはCSVファイルか、xlsxファイルが対応しています。
また、最初の行には、データラベルをつけ、縦に長いデータ配列にする必要があります。サンプルデータをつけています。ご確認ください。
- もっともかんたんな方法です。しかし、オンライン使用を前提につくられていないため、一部の機能が使えません(フォントの変更やブックマーク)。
-
Use offline
a. 不足しているパッケージをインストールする。
b. C:\Users\your user name\Documents\Rにフォルダを作成し、各Rファイルとwwwを収納する。
c. Rstudioを起動し、右下のウィンドウからダウンロードした「ggplot2_GUi.Rproj」をダブルクリックする。
d. ▶Run App をクリックする。
- 伏見駿亮(Fushimi Shunsuke)
- Kyoto U
- f.shunsuke0402@gmail.com
二次配布を固く禁じます。